Investment-Unemployment Link Still On Track

When the recovery was getting started I pointed out the remarkably strong inverse relationship between fixed investment as a share of GDP and the unemployment rate, and argued that a policy that focused on getting businesses to invest more would help get the unemployment rate down.

The additional data from the past several years gives us a chance to check whether that relationship has held up. As shown in the following two charts, it has held up quite well.  The first time series chart shows that as investment has turned up as a share of GDP, the unemployment rate has fallen.  The increase in fixed investment thus far has been largely in the form of business fixed investment, though residential started to pick up last year.

The second chart is a scatter plot with unemployment on the vertical axis and the investment ratio (in percent) on the horizontal axis. The lines connecting each quarterly observation represent the path from one quarter to the next. The chart illustrates the close correlation between the two variables. It also shows that the movement of unemployment and the investment ratio during the recovery (the recent dates are marked) has roughly paralleled the path in the recession, but in the reverse direction.  The problem, of course, is that the reverse path is way too short.  Investment has increased very slowly and has a long way to go before it gets back to levels that correspond to the 5 percent range for unemployment that we would like to see.  So the message in the charts is much the same as several years ago: economic policies that focus on more private investment are likely to also reduce unemployment.

These diagrams would look very much the same if the denominator in the investment ratio was potential GDP rather than actual GDP. Of course, things other than investment can affect unemployment, and the correlation does not prove causation. As I pointed out here in a reply to comments on my original post, the correlation between investment and unemployment was also strong in the 1970s, through the scatter of points would be higher in the diagram then because demographic factors raised the average rate of unemployment.

Posted in Budget & Debt | Comments Off on Investment-Unemployment Link Still On Track

Same Old Slow Recovery

The data released last week generated a lot of news stories, first bad ones about the GDP numbers and then good ones about the employment numbers. When you put the numbers in perspective, however, the economic story is little changed from what we have been experiencing for several years now: a continued weak economic recovery.

If you average out the -.1% and 3.1% growth in the third and fourth quarters, you get 1.5% growth for the second half of 2012 which is the about the same for the year as a whole, and down from 2% in 2011 and from 2.4% in 2010.  Here is an update of two charts I have used in past posts to show the weak growth compared to the early 1980s recovery and compared to the economy’s potential.  Growth is still much less than the 1980s recovery, and the gap between actual and potential GDP is not narrowing.

The jobs report shows that employment growth is still barely keeping up with the growth of the population, and not nearly enough to bring labor markets to pre-recession levels. The percentage of the working age population with a job has yet to take off.  Here is an update of a chart I have used in earlier posts to illustrate this. It is the same worrisome story.

Posted in Slow Recovery | Comments Off on Same Old Slow Recovery

Break the Silence on the Unemployment Problem

In his inaugural address, President Obama said that “An economic recovery has begun.” It was an applause line. The line is correct of course, but it is really nothing to applaud.  As economists define it, the recovery began nearly four years ago when the 2007-2009 recession ended in June 2009.  So we have had a recovery for most of the Obama Administration.  The problem is that it is a recovery in name only, one of the weakest recoveries in American history.  Growth has been about 2 percent since the recovery began and median household income has declined. That is far less economic growth than recoveries following deep recessions with financial crises in American history.

This slow recovery has left unemployment tragically high in most parts of the country. In the San Francisco Bay Area where I live we are relatively lucky. In San Francisco the unemployment rate is 6.7%. The rate is 7.8 % in the country as a whole, and 9.8 % in the state as a whole. In the nearby central valley—cities like Yuba City, Modesto, Merced, Fresno—it’s about 15%, and down south in El Centro California it’s 27%.

The numbers would all be worse if they included the unusually large number of people who have dropped out of the labor force and are no longer counted as unemployed.  If they counted, the national unemployment rate would be 9.1 percent. Another way to think about this is to look at the fraction of working age adults who are employed. Though this number usually rises during recoveries, it is actually smaller now than when the recovery began.

But you know even that relatively low 6.7% in San Francisco is pretty terrible.  I like to tell the story about what Senator Hubert Humphrey said when President Ford’s Council of Economic Advisers, where I worked with Alan Greenspan, reported to the Joint Economic Committee (JEC) that it was raising the definition of the normal unemployment rate from 4.0% to 4.9%.  Humphrey, who chaired the JEC, was outraged and told us in the JEC hearing that “if the country was suffering a plague and you economists were doctors your solution would be to raise the definition of normal body temperature above 98.6 degrees”

So I am worried when people stop talking about today’s very high unemployment rates as if they were normal.  It is not a good sign that the inaugural address was silent on the subject, not even including the word unemployment.

Posted in Slow Recovery | Comments Off on Break the Silence on the Unemployment Problem

A Debt Limit Strategy Rather Than Tactics

The recent debate about the debt limit focuses on the negative economic impact of a decision by the government not to increase the debt limit. That’s why President Obama says he is asking for clean debt limit increase—one not linked to spending reductions, saying that a default would cause economic harm, and that we should not play chicken with the American economy.

But with current high and growing debt levels a clean debt limit increase would also hurt the economy. If politicians just increase the debt limit now without reducing the rapid growth of spending, then they will be expected to do so in the future and the debt explosion will continue to create a drag on the economy with a likely future crisis. The time pattern may be different with a clean debt limit increase–if kicking the can down the road postpones the harm, but the overall impact is negative, and it could be worse if there is a debt crisis.

There is an obvious way to prevent both evils: follow a policy strategy which links debt limit increases to reductions in the growth of spending. By focusing on tactics–games of chicken, leverage and threats—Washington is ignoring this sensible policy strategy.

In a recent technical paper my colleague Bob Hall, rigorously works out the effects of severing the link between debt increases and deficit spending. He defines a parameter which he calls “alpha.” It’s simply the amount by which politicians reduce the deficit when they increase the debt, measured as a fraction of the debt to GDP ratio. In other words, alpha is an indicator of how much the government “leans against” the debt. As Bob puts it: “Alpha is all-important in the analysis….Governments with no tendency to lean against debt, with alpha = 0, face a likelihood but not a certainty of debt crisis.” The problem with a clean debt limit increase is that it effectively sets alpha to 0.

A much better value of alpha, as Bob shows, is around .1, which, if you measure spending reductions on a ten year basis, translates to .1X10 or 1, or, in other words, a strategy like the one-to-one link sometimes called the Boehner rule. So while some may think of such a rule a threat, it is really a strategy, and a sensible strategy in my view.

Posted in Budget & Debt | Comments Off on A Debt Limit Strategy Rather Than Tactics

No Debt Fix In Sight

The election is over, the fiscal cliff is over, and the problems remain.

For the past several years on this blog I have been showing simple charts to monitor progress—or lack of progress—on the persistent deficit and the growing debt, which in my view are impediments to returning to strong economic growth. Unfortunately neither the election nor the fiscal cliff deal has resulted in any meaningful change in these budget charts.

Here is the latest spending chart. It shows the Administration’s spending proposal prior to the debt deal of 2011, a CBO forecast with the fiscal cliff deal, and my pro-growth alternative which would balance the budget.

Clearly we still have a long way to go to bring spending growth down and thereby reduce spending as a share of GDP. The battle in Washington in the next few years will be where between the black and the green line we go.

Note that the CBO forecast is based on its alternative fiscal scenario, which is very close to what actually happened in the so-called fiscal cliff deal. As the CBO stated in their August 2012 report “That scenario incorporates the assumptions that all expiring tax provisions (other than the payroll tax reduction in effect in calendar years 2011 and 2012) are extended; the alternative minimum tax (AMT) is indexed for inflation after 2011; Medicare’s payment rates for physicians’ services are held constant at their current level; and the automatic spending reductions required by the Budget Control Act of 2011 (Public Law 112-25), which are set to take effect in January 2013, do not occur.”

Moreover, the tax increase in the fiscal cliff deal has not affected the budget deficit in any substantial way. The assumption is that this tax increase will raise revenues by about $600 billion over ten years—probably an over statement as people adjust to the higher rates. But even that $600 billion is only .3 percent of GDP which is expected to be about $201,000 billion over that ten year period. This would hardly be noticeable in the spending chart.  So the scary the 2012 fix the debt chart and 2009 fix the debt video still apply in 2013.

Posted in Budget & Debt | Comments Off on No Debt Fix In Sight

Are these the shadows of the things that Will be…

. . . or are they the shadows of things that May be, only?

But if the courses be departed from, the ends will change.  So go back to First Principles, 102ff


Posted in Budget & Debt | Comments Off on Are these the shadows of the things that Will be…

Five-Year Anniversary of the End of the Great Moderation

Five years ago this month the Great Moderation ended. To be precise December 2007 is the month that the NBER business cycle dating committee designated as the peak of the third and final expansion of the Great Moderation and the beginning of the Great Recession.

Hundreds of research papers have been written on the nature and causes of the Great Moderation, which got started around 1983. While that research began long after the Great Moderation got underway (I published one of the earliest papers on it in 1998), we should not wait so long to start seriously researching the causes of the post-Great Moderation period, regardless of how this period is eventually named by economists.

In my view, the framework that Ben Bernanke used in a February 2004 paper to study the causes of the Great Moderation is a good one. It goes back to research that started before the Great Moderation. Bernanke characterized the Great Moderation as a reduction in (1) the variance of inflation and (2) the variance of real GDP. He used the following diagram (it is a replica of Figure 1 in his paper) in which these two measures are on the horizontal and vertical axes respectively. Using the diagram he represented the Great Moderation as a move from point A to point B. He showed that a primary cause was better monetary policy, and he represented this by showing that better policy brought the economy closer to the true policy tradeoff curve (TC2) rather than the occurrence of a shift in the curve (from TC1 to TC2) . I completely agree with that interpretation.

But what caused the end? I have updated Bernanke’s diagram by adding a point C and a line from point B to point C (in red), based on the empirical volatility measures in the table below for the three periods. Observe that the post-Great Moderation deterioration does not simply retrace the previous improvement. It is nearly vertical, reflecting that virtually all the deterioration is in the output variability dimension.

In my view monetary policy was a major factor in the end of the Great Moderation just as it was the major factor in the Great Moderation itself. I review the reasons for this view in this paper on central bank independence versus policy rules which I am presenting at the annual meeting of the American Economic Association next month.

Posted in Financial Crisis | Comments Off on Five-Year Anniversary of the End of the Great Moderation

EconTalk with Charts: A New Idea Well Executed

This week Russ Roberts released the third episode in his innovative new interview series called “The Numbers Game.” The innovation is to add graphs and other visuals—and thereby helpful numerical information—to his popular podcast interview series EconTalk.

The first three episodes go together to form a three part series on the economy and in particular on the nature and cause of the weak recovery from the 2007-2009 recession. The episodes also go together in that I was Russ’s guest on all three—yes, a volunteer subject for Russ’s new experiment.

All the episodes are on YouTube. The first episode establishes that the recovery actually has been weak—even compared to other recoveries following deep recessions and financial crises. The second episode examines the possible causes of the weakness, and the third episode concentrates on what, in my view, is the main cause—economic policy.

It’s challenging to integrate charts effectively into a podcast of an interview, but it’s very worthwhile, especially in economics.  Charts give the interviewee a chance to show the facts behind the arguments and then the interviewer can ask about and debate those facts. And it is even possible for the interviewer to add some challenging new charts as Russ did with a bar chart on a survey of economists in the third episode. Charts are also an invaluable way to convey ideas, and, speaking as a teacher, that’s why I love charts.

I think that Russ and his collaborator in this new endeavor, Shana Farley, have done a fantastic job. They have thought about everything, including putting up little caricatures of Russ and his guests like the one of me here. I hope they keep it up with many more episodes of The Numbers Game.

Posted in Teaching Economics | Comments Off on EconTalk with Charts: A New Idea Well Executed

More Monetary Policy Uncertainty

The Fed’s announcements yesterday increase monetary policy uncertainty in two fundamental ways.

Quantitative Easing on Steroids?

First, the new quantitative easing announcement implies a gigantic increase in the size of the Fed’s balance sheet and thus effectively an amplification of the policy risks and uncertainty which I have discussed, for example, in this oped with George Shultz and other colleagues in September. The Fed now plans to purchase $85 billion a month of longer-term Treasury and mortgage backed securities until there is substantial improvement in the labor market, which requires a completely unprecedented increase in reserve balances as illustrated in this chart.

The chart shows reserve balances held by banks at the Fed. These are used to finance the large scale asset purchases.  The chart assumes that substantial labor market improvement is defined by the 6.5% unemployment rate the Fed is using to assess when to raise interest rates. Thus, assuming the central tendency forecast of the FOMC, the announced buying spree will bring reserve balances to about $4 trillion in mid-2015. The risk is two-sided. If the Fed does not draw down reserves fast enough during a future exit, then it will cause inflation. If it draws them down too fast, then it will cause another recession.

Another Great Deviation On the Way?

Second, the new state-based zero interest rate policy will lead to interest rates far below levels that created good performance in the past and close to levels that eventually created high unemployment. In an effort to explain the new policy during the press conference yesterday, Ben Bernanke referred to the Taylor rule, saying:

“So it’s really more like a reaction function or a Taylor rule if you will. I don’t want–I’m–I’ll get it–I’m ready to get the phone call from John Taylor. It is not a Taylor rule but it has the same feature that it relates policy to observables in the economy such as unemployment and inflation.”

In fact, the Fed’s new state-based policy calls for the federal funds rate to stay way below the Taylor rule, as did the calendar-based policy. You can see this deviation in two ways: a chart or some algebra.

Consider the following chart (an updated version of a chart due to Bob DiClemente) which I used in my talk last month at the Cato Institute. The red line shows the interest rate according to the Taylor rule with the future values based on FOMC forecasts for inflation and growth. The zero interest rate forecasts by most FOMC members (shown by the dots) for mid-2015—a time when, they forecast, the unemployment rate will be about 6.5 percent—are more than 2 percentage points below the Taylor rule. (The gray line is a version of the Taylor rule used by Janet Yellen and others at the Fed.)

You can also plug in values into the Taylor rule:

R = 2 + π + 0.5(π – 2) + 0.5Y

where R is the federal funds rate, π is the inflation rate, and Y is the GDP gap.

Assume that Y = -2(U-5.5) where U is the unemployment rate and 5.5 is the long-term unemployment rate implied by FOMC projections. Then when the unemployment rate is 6.5% and the inflation rate is 2%, the interest rate is 2+2 -1 = 3%. So there is a 3 percent deviation.

The last time the deviation between the Taylor rule and the actual rate was this large was in the “too low for too long” period of 2003-2005 which helped create the boom which led to the bust, the financial crisis, and the recession. High unemployment was the result. The deviation was also this large during the economic mess of the 1970s. High unemployment, along with high inflation, was the result then too.

Comparison with Larry Ball’s Calculations

Larry Ball did a very similar algebraic calculation with similar conclusions about the difference between the Fed’s future policy rate and the Taylor rule, which Greg Mankiw posted on his blog earlier today.

However, Larry finds that the actual interest rate was not below the Taylor rule in the 2003 period. This result is contrary to empirical research by George Kahnme and others. The difference may be due to Larry’s using an implied coefficient on the output gap which is larger than .5. Nevertheless, the deviation Larry uncovers is much larger than in the 1970s, which in itself raises risks.

Posted in Monetary Policy | Comments Off on More Monetary Policy Uncertainty

Recent Books to Read on Rules-Based Money

For a respite from the saga of the fiscal cliff why not read some of the latest books on monetary economics and policy? Below is a list of books on money published in 2012 which I found to be interesting and provocative. You can find a common theme in these books: that poor economic performance provides convincing evidence of the need for a sound rules-based monetary policy. But you can also find disagreement about how to achieve such a policy with proposals for interest rate rules, money growth rules, fixed exchange rate systems, nominal GDP targeting, and gold and commodity standards. Though my favorite is a simple interest rate rule (also discussed in this book on the Taylor rule), one can learn a lot by studying the case for other rules.

Boom and Bust Banking: The Cause and Cures of the Great Recession, David Beckworth (Ed,) The Independent Institute, Oakland, California, 2012.

I enjoyed reading this book, perhaps because I agree so much with the general themes and conclusion that U.S. monetary policy—by creating a boom and a bust—led to the financial crisis and the great recession. But, as I said in my back cover review of the book, David Beckworth and the other authors—including Lawrence H. White, Diego Espinoza, Christopher Crowe, Scott Sumner, Jeffrey Rogers Hummel, William Woolsey, Nick Rowe, Josh Hendrickson, Bill White, Larry Kotlikoff, and George Seglin—go much further. For example, the chapter by David Beckworth and Christopher Crowe puts forth their original theory of the Fed’s “monetary superpower” status and the resulting unfortunate international repercussions of these boom-bust monetary policies. Scott Sumner writes on why nominal GDP targeting would work better than recent and current policy, and Larry Kotlikoff explains how his narrow banking proposals would help to prevent future crises. More generally the authors of this book show why economic policy got off track, why alternative explanations of the boom—such as a global-saving glut—are flawed, and why monetary policymakers must return to rules-based policies in the future.

The Unloved Dollar Standard: From Bretton Woods to the Rise of China, Ronald McKinnon, Oxford University Press, 2013, available on Amazon, Dec. 27, 2012

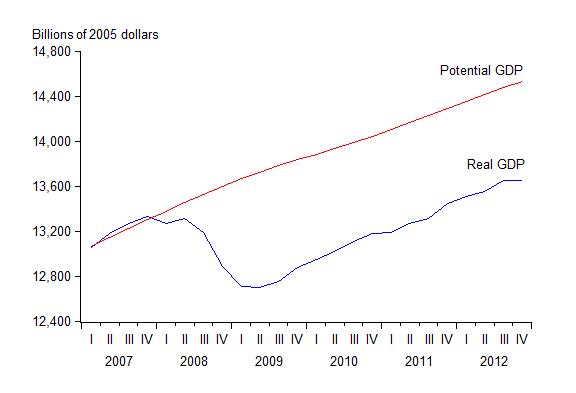
The clever irony of this title, of course, is that the world is still largely on the dollar standard, despite its being unloved. Ron McKinnon, my Stanford colleague, begins by asking why the dollar standard is “unloved” and explains that it is because U.S. monetary policy has often been mismanaged. He particularly laments the periods when U.S. monetary policy caused global instability, including the “Nixon shock” with the ensuing inflation in the 1970s and what he calls the “Bernanke shock” in recent years, and on the latter he is on the same page as David Beckworth and Christopher Crowe. McKinnon is much more positive about policy in the 1980s and 1990s. He clearly explains why the Fed’s current zero interest rate policy causes destabilizing carry trade opportunities and commodity bubbles, and is interfering with the allocation of capital. He also shows why, despite all these problems, the world has continued to use the dollar, warning that it will not last if American monetary policy does not mend its ways. McKinnon has always been an advocate of rules-based policy, but has focused on an international system of fixed rather than flexible exchange rates, and that view is evident throughout the book.

Roads to Sound Money, Alex Chafuen and Judy Shelton, Atlas Economic Research Foundation, Washington D.C. 2012

As the title suggests, this collection of essays, which Judy Shelton and Alex Chafuen have put together, makes the case for many different “roads” to the goal of a sound rules-based monetary system with contributions by Gerry O’Driscoll, Steve Hanke, Allan Meltzer, Jerry Jordan, Sean Fieler, Lew Lehrman, George Selgin, and Lawrence H. White, the latter two contributors also included in the Beckworth collection. Shelton gives a nice short summary of all the chapters in the Forward. For example, O’Driscoll hammers home the inherent problems with discretionary monetary policies and shows why he believes the gold standard would be an improvement despite its imperfections, a proposal that Lew Lerhman makes the case for in his chapter and in more detail in the second edition of his book The True Gold Standard. In contrast, in Meltzer’s nice review of his monumental history of the Fed, he concludes that a more rules based policy like we had in the 1980s and 1990s would be sufficient. Hanke reminds us that good monetary policy means more than keeping inflation low, and raises questions about the view that policy is just fine if an inflation target is hit. Seglin’s essay in an informative excursion into the operations of the New York Fed in the money markets with a concrete proposal for the Fed to dramatically broaden and increase the number of dealers it engages with. Jerry Jordan’s essay focusses on fiscal discipline rightly arguing that bad fiscal policy usually leads to bad monetary policy.

The Great Recession: Market Failure or Policy Failure? Robert Hetzel, Cambridge University Press, 2012.

Hetzel makes a compelling case that policy failure was the main cause of the recent financial crisis, and more generally that “monetary disorder” rather than a “market disorder” is the cause of poor macroeconomic performance over many years. At the same time, he acknowledges and discusses disagreements among those who argue for rules rather than discretion. For more details see my review of this book from Economics One earlier this year.

Volcker: The Triumph of Persistence, William Silber, Bloomsbury Press, New York, 2012.

This book is all about monetary policy making in practice. It shows in fascinating detail how Paul Volcker, starting in 1979, was able to implement a major change for the better in monetary policy that lasted for more than two decades. It also shows how Volcker learned how to implement such a change while working as Under Secretary of the Treasury under George Shultz in the early 1970s. For more details see my review of this book from the Wall Street Review earlier this year.

Posted in Monetary Policy | Comments Off on Recent Books to Read on Rules-Based Money