The election is over, the fiscal cliff is over, and the problems remain.
For the past several years on this blog I have been showing simple charts to monitor progress—or lack of progress—on the persistent deficit and the growing debt, which in my view are impediments to returning to strong economic growth. Unfortunately neither the election nor the fiscal cliff deal has resulted in any meaningful change in these budget charts.
Here is the latest spending chart. It shows the Administration’s spending proposal prior to the debt deal of 2011, a CBO forecast with the fiscal cliff deal, and my pro-growth alternative which would balance the budget.
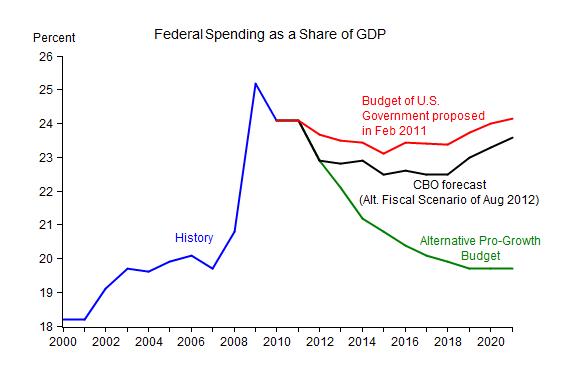
Clearly we still have a long way to go to bring spending growth down and thereby reduce spending as a share of GDP. The battle in Washington in the next few years will be where between the black and the green line we go.
Note that the CBO forecast is based on its alternative fiscal scenario, which is very close to what actually happened in the so-called fiscal cliff deal. As the CBO stated in their August 2012 report “That scenario incorporates the assumptions that all expiring tax provisions (other than the payroll tax reduction in effect in calendar years 2011 and 2012) are extended; the alternative minimum tax (AMT) is indexed for inflation after 2011; Medicare’s payment rates for physicians’ services are held constant at their current level; and the automatic spending reductions required by the Budget Control Act of 2011 (Public Law 112-25), which are set to take effect in January 2013, do not occur.”
Moreover, the tax increase in the fiscal cliff deal has not affected the budget deficit in any substantial way. The assumption is that this tax increase will raise revenues by about $600 billion over ten years—probably an over statement as people adjust to the higher rates. But even that $600 billion is only .3 percent of GDP which is expected to be about $201,000 billion over that ten year period. This would hardly be noticeable in the spending chart. So the scary the 2012 fix the debt chart and 2009 fix the debt video still apply in 2013.


