Unforgettable Economics Lessons in Tombstone

Last night Yang Jisheng was awarded the 2012 Hayek Prize for his book Tombstone about the Chinese famine of 1958-1962.  It’s an amazing book. It starts with Yang Jisheng returning home as a teenager to find a ghost town, trees stripped of bark, roots pulled up, ponds drained, and his father dying of starvation. He thought at the time that his father’s death was an isolated incident, only later learning that tens of millions died of starvation and that government policy was the cause.

Then you read about the Xinyang Incident: people tortured for simply suggesting that the crop yields were lower than exaggerated projections. Those projections led government to take the grain from the farmers who grew it and let many starve; and there are the horrific stories of cannibalism.

You also find out what life was like as a member of a communal kitchen. With free meals people first gorged themselves, but then food supplies ran out in a few months, and since there were no longer individual plots, people starved.   The communes had to use giant woks which required huge amounts of fuel.  So they clear-cut forests.

Political leaders blamed right-opportunists.  Mao wrote a memo, praising one of the communal kitchens, saying that “the whole country must follow this example.” That one was in a province that suffered the largest percentage of starvation deaths relative to population.

What does this have to do with Hayek?  On every page of Tombstone you see detailed case studies of what Hayek warned about: the pretense of knowledge as political leaders thought they could do away with the family and individual initiative, but ended starving 36 million people to death in the mother of all unintended consequences; the ludicrousness of an economic system which tries to do away with prices to provide information, signals, and incentives, and replaces it command and control; the dangers of repressing freedom and thereby creating a cruel silence which allowed starvation conditions to continue.

It‘s not easy to explain abstract ideas like economic freedom and the rule of law. Yang Jisheng’s Tombstone gives plenty of unforgettable examples.

Posted in Teaching Economics | Leave a comment

Why Title II of Dodd-Frank Has Not Reduced the Likelihood of Bailouts

Today the House Financial Services Subcommittee on Oversight and Investigations held a hearing on whether the Orderly Liquidation Authority (OLA) in Title II of the Dodd Frank Act has reduced the likelihood of bailouts of large financial firms. I was one of the witnesses. Here is a summary of my 5 minute opening statement.  More details are in my written statement
          Unfortunately the likelihood of bailouts has not been reduced by Dodd-Frank. Empirical evidence shows this: large financial firms still pay less to borrow because of market expectations of bailouts. Of course there’s disagreement about this assessment. Ben Bernanke argued in testimony in February that “Those expectations are incorrect” because we have Title II. But other officials differ: President Charles Plosser of the Philadelphia Fed says “Title II resolution is likely to be biased toward bailouts,” and President Jeffrey Lacker of the Richmond Fed admits “we didn’t end too big to fail.”
         When you look at OLA and assess what would happen in another crisis you can see why bailouts are still likely. To carry out the difficult task of reorganizing a large financial firm under OLA, the FDIC would have to exercise a great deal of discretion which causes unpredictability and uncertainty compared with bankruptcy reorganization.  Thus, there’s confusion about the reorganization process. Without more clarity, policymakers are likely to ignore it in the heat of a crisis and again resort to massive bailouts.
         Even if Title II were used, bailouts would be expected. The FDIC would most likely give some creditors more funds than under bankruptcy law. By definition that’s a bailout of the favored creditors.  Even if shareholders are not protected, some important creditors are.
         It is important to recognize that the perverse effects of bailouts occur whether the source of the extra payment comes from the Treasury—financed by taxpayers, from an assessment fund—financed by banks and their customers, or from smaller payments for less favored creditors.  
         There are other concerns. Under bankruptcy reorganization, private parties, motivated and incentivized by profit and loss considerations, make key decisions about the direction of the new firm, perhaps subject to bankruptcy court oversight. But under Title II a government agency, the FDIC and its bridge bank, would make the decisions.  This creates the possibility that the bridge firm would be pressured to grant favors.
         In addition, the new bridge firm could have advantages over its competitors due to the Treasury funding subsidy, lower capital requirements, and tax exemptions.   
         A reform of the bankruptcy code (called Chapter 14).designed to handle the big firms is a better best way to reduce the likelihood of bailouts. The goal of the reform is to let a failing financial firm go into bankruptcy in a predictable, rules-based manner without causing disruptive spillovers in the economy while permitting people to continue to use its financial services.
Posted in Financial Crisis | Leave a comment

10 Years Doing Business, Measuring Results, and Now Bill Gates

Rumors are flying around that the World Bank will water down or even abandon its ten-year old Doing Business series which measures the extent and quality of pro-growth economic policies in individual countries round the world.  A committee has been set up by World Bank president Jim Yong Kim to review the series. People are naturally writing and worrying about the outcome.

What a terrible mistake it would be to end or dilute this useful measurement system. I remember when the Doing Business reports first started. I was Under Secretary of Treasury with responsibility for U.S oversight of the World Bank.  The Doing Business series was part of a response to a concentrated effort by the U.S government to improve effectiveness and measurement of development assistance—both multilateral and bilateral—a subject I gave a bunch of speeches about. It was at that time that the U.S. proposed and created the Millennium Challenge Account whereby U.S. bilateral development aid would be directed more toward countries following good pro-growth policies based on certain measurable criteria.   A lot of economic research at the Treasury and other U.S. agencies went into choosing those selection criteria, which ended up including items such as those now covered in the Doing Business report,including the time it takes to start a business.

This was also the first time that the U.S. insisted on linking the size of its contributions to the World Bank’s program for poor countries to specific measures of the delivery and effectiveness of the aid.  The straightforward idea was that insisting on measurable results would make aid more effective in reducing poverty and improving people’s lives.  The story of the “measurable results” campaign is told in my book Global Financial Warriors.

It’s good that Bill Gates is now writing a lot about this idea.  As he put it in his recent Wall Street Journal piece My Plan to Fix The World’s Biggest Problems “In the past year, I have been struck by how important measurement is to improving the human condition. You can achieve incredible progress if you set a clear goal and find a measure that will drive progress toward that goal….This may seem basic, but it is amazing how often it is not done and how hard it is to get right.”

The committee reviewing Doing Business should read Gates piece, examine the positive benefits of this approach when used over the past 10 years, and strengthen, not weaken, Doing Business.

Posted in Regulatory Policy | Comments Off on 10 Years Doing Business, Measuring Results, and Now Bill Gates

Another Take on Reinhart-Rogoff Controversy

The updated charts below incorporate last Friday’s release of the first quarter GDP data.  They continue to tell the story of a weak recovery which, in my view, is largely due to ineffective government policy interventions.  There is, of course, an alternative view: that the recovery is weak because the recession and the financial crisis were severe.

This alternative is based on research by Carmen Reinhart and Kenneth Rogoff claiming that weak recoveries typically follow deep recessions and financial crises. That claim is frequently cited by government officials as the reason why policy has not been the problem.   To be sure this is not the widely-cited research by Reinhart and Rogoff on the debt-growth nexus which has generated so much controversy recently (including a parody on the Colbert Report), but it’s quite related from a policy perspective and equally controversial.

Much as Thomas Herndon of the University of Massachusetts found problems with the “debt growth nexus” result, economic historian Michael Bordo of Rutgers found problems with the “weak recovery is normal” result.  Bordo wrote about his findings (which are based on his joint research with Joe Haubrich of the Cleveland Fed) in a September 27, 2012 Wall Street Journal article, “Financial Recessions Don’t Lead to Weak Recoveries.”  In discussing the view that weak recoveries follow deep recessions, Bordo wrote that “The mistaken view comes largely from the 2009 book This Time Is Different, by economists Carmen Reinhart and Kenneth Rogoff…” and he then showed that U.S data disprove that view. (I wrote about this here and here).

An important question for public policy is why Bordo’s discovery got so much less press attention than Herndon’s.  Maybe Bordo’s historical research is inherently less interesting than Herndon’s discovery of spreadsheet error (it’s certainly harder for Stephen Colbert to parody), but another reason is that Herndon’s findings support more fiscal stimulus and less consolidation–still popular in some quarters–while Bordo’s findings don’t.

Here are the charts:

graph08


graph09


Posted in Slow Recovery | Comments Off on Another Take on Reinhart-Rogoff Controversy

A Key Issue In the Monetary Policy Debate

I’ve been speaking a lot about monetary policy recently:
Testifying at the Joint Economic Committee (JEC) last week
Delivering a dinner speech at the Atlanta Fed the week before that
Giving remarks at Mervyn King’s farewell conference on a policy panel in London
Testifying at a House hearing on monetary policy last month
In each venue, someone has been on the other side, supporting current policy.
– At the JEC: Adam Posen (president of Peterson Institute and coauthor with Ben Bernanke)
– At the Atlanta Fed: Ben Bernanke giving a dinner speech the previous night
– At the King conference: Janet Yellen on the same policy panel
– At the House: Joe Gagnon (of the Peterson Institute with Adam Posen)

In the midst of all this debate, there is a crucial issue which explains much of the enormous difference of opinion between critics and supporters of the Fed’s current policy. Critics such as me and Allan Meltzer (who also testified at the JEC) argue that monetary policy should focus on a clear strategy for the instruments of policy. A goal for inflation or other measures of macro performance is not enough if it is simply part of a whatever-it-takes approach to the instruments. Such an approach results in highly discretionary and unpredictable changes in policy instruments with unintended adverse consequences, as we have been seeing in recent years.

Supporters such as Adam Posen at the JEC hearing are just fine with the Fed using, even year after year, a whatever-it-takes approach to the instruments of policy as long as there is an overall goal.  With such a goal in mind, so their argument goes, the central bank can and should always intervene in any market, by any amount, over any time frame, with any instrument or program (old or new), and with little concern for unintended consequences in the long run or collateral damage in the short run (say on certain groups of people or markets) as long as it furthers that goal.

Critics are very concerned about those unintended consequences and collateral damage; they are also concerned about an independent government agency wielding such a great deal of power as it carries out a year-after-year whatever-it-takes approach. Supporters are much less concerned.

Posted in Monetary Policy | Comments Off on A Key Issue In the Monetary Policy Debate

Coding Errors, Austerity, and Exploding Debt

The discovery of errors in the Reinhart-Rogoff paper on the growth-debt nexus is already impacting policy. A participant in last Friday’s G20 meetings told me that the error was a factor in the decision to omit specific deficit or debt-to-GDP targets in the G20 communique.  It’s also a new talking point in the battle over the budget—offered as a reason why the U.S. should stop worrying about budget reform and consolidation and start worrying about austerity.     
            But the main arguments now for controlling the growth of spending and gradually bringing the U.S federal budget into balance overpower any one study, right or wrong.  First, under current budget policy the debt to GDP ratio will grow at such an explosive rate in the future that, if allowed to continue, will cause economic damage according to virtually any study.  Recall that the CBO projects that under current law the federal debt held by the public will be rising to 250% in 30 years.   Even this is an underestimate if interest rates rise faster than assumed by CBO. If CBO went out further in time, as they used to, the debt ratio goes over 700%.
            Second, the claims about austerity in the current budget proposals are exaggerated. Consider the recent House budget proposal which balances the budget in 10 years without raising taxes by gradually reducing the growth of spending.  It would reduce federal outlays as a share of GDP by 3.1 percentage points over the next decade (from 22.2% in 2013 to 19.1% in 2023).  Critics label it austere, but this is less spending restraint than the 4.1 percentage point reduction in outlays as a share of during the 1990s (when spending fell from 22.3% in 1991 to 18.2 % in 2000).   With this spending restraint, the 1990s were a very good decade for economic stability and growth, and they left the budget in balance.  The same can be said for the next decade. The benefits of properly addressing the debt and deficit problems are enormous and the costs are surprising small.    
Posted in Budget & Debt | Comments Off on Coding Errors, Austerity, and Exploding Debt

Krugman’s Claims Are Wrong

Paul Krugman commented early this morning on the Wall Street Journal oped by John Cogan and me.  Our oped is based on our research paper with Volker Wieland and Maik Wolters which shows that there are beneficial effects on the economy—in the long run and the short run—of a ten-year program to reduce the budget deficit, and eventually balance it, as proposed by the House Budget Committee.
Krugman’s claims about this research are wrong.
He complains that we get these results “because confidence!” But we never mention confidence in the oped or in the research paper with the simulation results. Our model includes concepts like the permanent income hypothesis, incentive effects, and of course people taking expectations of the future into account when they make decisions
Krugman claims that we are unfamiliar with research by “Mike Woodford, who they appear never to have read.”  In fact, the research paper by Mike Woodford, who was the co-editor with me of the first Handbook of Macroeconomics, refers to our modeling research and we in turn have referred to his paper in subsequent research (pp. 85-114).  Moreover, the research of ours that Woodford refers to was validated by many researchers at central banks and international financial institutions.
Krugman disagrees with our statement that “resources to finance government expenditures aren’t free—they withdraw resources from the private economy” saying this isn’t so in a depressed economy.  But the whole point of our simulations is to show how a gradual and credible fiscal consolidation will help get the economy out of its depressed state and into an economic situation where people recognize that lower growth of government spending eventually means lower taxes and more take home income.
The paper by Woodford that Krugman refers to uses expectations, as we do, but that paper is about a completely different policy question.  As Woodford says he considers “only the consequences of temporary variations in the level of government purchases.” In contrast, in our Wall Street Journal article and our research on fiscal consolidation we consider the effect of permanent changes in government spending which are phased in over time to bring the budget deficit down.
Not mentioning this crucial difference, Krugman goes on to claim that we get our results because “we have slipped in some assumption” and then guesses what that might be. In our oped, we summarize the assumptions and the reasons for our result that the plan is good for the economy, and a higher interest rate is not one of them.
Posted in Fiscal Policy and Reforms | Comments Off on Krugman’s Claims Are Wrong

Economic Freedom For All

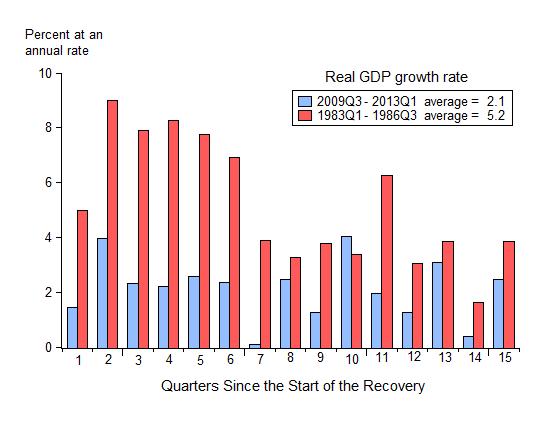
In talks about my book First Principles I argue that shifts toward and away from the principles of economic freedom have had profound effects on economic performance.  From the mid-1960s through the 1970s, deviations away from economic freedom were large, economic policy was bad, and economic performance was poor with rising unemployment and inflation and falling economic growth.  During the 1980s, 1990s, and until recently, deviations were smaller, policy was better, and economic performance improved; unemployment and inflation declined and growth picked up.  In recent years policy has been poor and so has economic performance with high unemployment and low economic growth. 
Many ask about how changes in the distribution of income fit into this story. While people with lower incomes benefitted from the less frequent recessions and lower unemployment during the Great Moderation of the 1980s and 1990s, the income distribution widened. As Emmanuel Saez of Berkeley and others have shown using IRS income data, the distribution became more concentrated in the upper tails starting in the mid to late 1970s and has remained concentrated, though the past decade with a deep recession and slow recovery has seen a hiatus in that trend.
There are of course a number of limitations of such income distribution statistics:  IRS data are not ideal for measuring income because people simply report more income when the tax rate goes down.  Taxes and transfers are not in the IRS income data, and these reduce inequality.  Consumption is less unequal than income by many measures.  Equality of outcome is not the same as equality of opportunity or personal equality (“all men are created equal”).  Income mobility and intergenerational mobility are not captured by these data.  A good absolute safety net is more important than the relative income distribution which is emphasized in such data. There are benefits from inequality of outcomes including the performances of Beyonce or Jay-Z and the many benefits from philanthropy.
           
But even considering these issues, the widened income distribution is a cause for concern in my view because it indicates harm to those at the bottom and signals a growing inequality of opportunity.
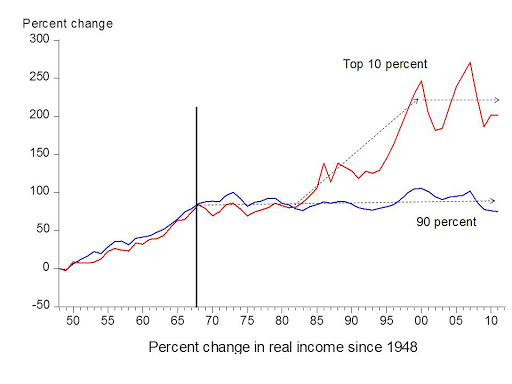
To better understand what is happening, I find the following chart quite revealing. It shows real income growth since the end of World War II for the upper 10% and the lower 90 % income groups.  It is based on the Saez data. From the end of World War II until the mid-1960s real income growth was strong across the board, and thus there was relatively little change in the distribution of income. Then, in the late 1960s and 1970s the growth of real income slowed dramatically for both groups.  This coincided with the terrible economic policy and the economic turbulence of that era. Then, coinciding with the Great Moderation of the 1980s and 1990s, income growth sped up. But most growth was in the upper income group, with the lower 90% seeming to move sideways.  In more recent years, which coincide with the swing back to less effective economic policies, income growth has slowed again across the income distribution.
The slow income growth for all in the 1970s and in recent years is consistent with the story about deviations from economic freedom.  But what was going on in the 1980s and 1990s? Why was an increase in economic freedom associated with a speed up of income growth for the upper income group and not others?
A large body of research documents that returns to education started increasing in the 1980s as evidenced by the growing college and high school wage premium.  If the supply of those completing high school, with some going on to college, had increased to keep pace with the increase in returns, it is unlikely that we would have seen such a large widening of the distribution.  But supply did not increase. High school graduation rates hit a peak around 1970 and then started declining.  The US international rank in test scores fell. 
The source of the income distribution problem is thus related to a poor education system. We are restricting educational opportunities, especially for those who are disadvantaged.
In other words the explanation for the widening inequality is the restriction of economic freedom rather than the promotion of economic freedom.  Economic freedom did not mean economic freedom for all. Remember the students from the movie “Waiting for Superman”: Bianca, Emily, Anthony, Daisy, and Francisco who had such a small chance of winning the lottery to get into a school that would open up such opportunities?  Adhering more closely to the principles of economic freedom requires giving those kids more freedom of choice.
Not extending economic freedom to all in the area of education is only one example of how deviations from economic freedom can adversely affect the distribution of income. Regulatory capture by large firms, crony capitalism, deviations from the rule of law, bailouts of the creditors of large financial firms, and highly discretionary monetary policies which largely benefit insiders are other examples.
Ironically some argue that moving further away from the principles of economic freedom—with higher marginal tax rates or more regulations on firms or more discretion for regulators or more interventionist macro policy—is the way to improve the economy and the distribution of income.  That would be a great tragedy since history shows that over the long haul it has been more economic freedom that has pulled people out of poverty.   The point is not that income distribution isn’t a problem; it is that a poor diagnosis of the problem will lead us in the wrong direction. 
Posted in Regulatory Policy | Comments Off on Economic Freedom For All

An Opportunity to Compare and Contrast Budgets

It is good news that we now have both House and Senate budget proposals for FY 2014 to compare and contrast. This is a first step back toward old-fashioned regular budget order which will help get the country off of management by crisis, whether by debt limits, fiscal cliffs, sequesters, or continuing resolutions.  Regular order also gives us all an opportunity to participate in a more informed and open debate about where economic policy should be going. Of course the debate would be even better if the President had proposed a detailed budget before the House and Senate.  We can hope that this will occur next year.  

The chart below provides the key year-by-year macro facts needed to compare the House and Senate proposals.  In my view this kind of chart is more useful for comparing proposals than the ten-year multi-trillion dollar totals which few people can understand.  The chart shows the recent history of federal outlays along with the path of outlays as a percentage of GDP under the Senate proposal and under the House proposal.  There is a clear difference of opinion about the future in these two paths. Note how spending gradually comes down to pre-crisis levels as a share of GDP under the House plan and remains high under the Senate plan.  The chart also shows where revenues will be as a share of GDP under the two proposals in 2023: 19.1% for the House and 19.8% for the Senate.

So the obvious differences between the plans are that the Senate would (1) tax more than the House by .7% of GDP, (2) spend more than the House by 2.8% of GDP, and (3) run a deficit larger than the House by 2.1 percent of GDP, where the percentages are based on 2023.  Thus the bigger differences are in higher spending and larger deficits. In my view the House proposal is superior on all three counts especially given the sharp increase in spending in the past few years and the steady gradual reversal in the House plan as a share of GDP. 

It is anyone’s guess where the President’s budget and spending path will appear on this chart when it is submitted. In any case the debate over these two paths during the next few weeks will largely determine what the final budget agreement is.

Posted in Budget & Debt | Comments Off on An Opportunity to Compare and Contrast Budgets

Keep the Sequester Totals But Add Flexibility Within

Scare stories about the automatic reduction in federal spending to start on March 1—commonly called the sequester—fall mainly into two categories. First are the concerns that reducing every discretionary budget account by the same percentage—the “meat-axe” approach—would not allow government agencies to prioritize.  Hence the scare stories of having to furlough key emergency personnel. But this complaint is easily resolved if President Obama agrees to give agencies, including defense agencies, the flexibility to adjust their budgets within the overall sequester totals. Most Republicans in Congress would agree to this.

Second, the size of the total spending reduction for FY2013 is said to be too big and will slow down the economy. But if you put the reduction into perspective, as in the following chart, you can see that this claim is greatly exaggerated and likely to be false.

The chart shows federal outlays as a share of GDP as reported by the Congressional Budget Office in their latest budget outlook report. The past history and CBO baseline shows spending rising from 18.2% of GDP in 2000 and remaining relatively high at 22.8% of GDP in 2023 the last year of the CBO outlook. That baseline includes the sequester totals, so if Washington caves and reduces the size of the spending reductions, spending will be higher as shown in the graph.

Note that the reduction for 2013—the year currently under discussion—is very small relative to all the other changes in the budget during the quarter century period shown in the graph. It amounts to only 0.26% of GDP or $42 billion according to CBO.  This is less than half the frequently mentioned $85 billion in Budget Authority because it takes time to bring about the outlay reductions. The reduction is also quite gradual, much more gradual than the sudden rise in spending in the past few years, and, with flexibility granted to government agencies, does not have to be draconian.  The Administration and Congress agreed to roughly this amount of budget deficit reduction way back in 2011.

Note also that the reduction for this year should be viewed as a modest installment on an overall long-term strategy to bring the federal spending share down to levels consistent with balancing the budget.  We do not yet know what that strategy will be because the Administration has not submitted a budget and thus the Congress has not submitted budget resolutions. We do know that for that strategy to increase rather than decrease economic growth it is important that it be gradual and credible as illustrated by the “pro-growth” proposal which I sketched into the diagram above.  This pro-growth path brings spending to where it was in 2007 as a share of GDP and would also bring the federal budget roughly into balance—and thus get the debt to GDP ratio on a needed downward path—without any more tax increases.  CBO now projects revenue to be just over 19% in 2023 with the recent tax increases.

Research discussed here shows that such a path would increase economic growth even with the reduced spending share in 2013.  Indeed, as shown in the next graph total federal spending continues to grow according to the CBO GDP forecast.

Whether we get a strategy similar to what I propose here or something else, the diagram shows that postponing or skipping the relatively small installment for 2013 would sap much of the credibility out of any budget consolidation strategy.  From a macroeconomic perspective, providing the agencies with flexibility but sticking with the overall totals agreed to would be best for economic growth.

Posted in Fiscal Policy and Reforms | Comments Off on Keep the Sequester Totals But Add Flexibility Within