It is good news that we now have both House and Senate budget proposals for FY 2014 to compare and contrast. This is a first step back toward old-fashioned regular budget order which will help get the country off of management by crisis, whether by debt limits, fiscal cliffs, sequesters, or continuing resolutions. Regular order also gives us all an opportunity to participate in a more informed and open debate about where economic policy should be going. Of course the debate would be even better if the President had proposed a detailed budget before the House and Senate. We can hope that this will occur next year.
The chart below provides the key year-by-year macro facts needed to compare the House and Senate proposals. In my view this kind of chart is more useful for comparing proposals than the ten-year multi-trillion dollar totals which few people can understand. The chart shows the recent history of federal outlays along with the path of outlays as a percentage of GDP under the Senate proposal and under the House proposal. There is a clear difference of opinion about the future in these two paths. Note how spending gradually comes down to pre-crisis levels as a share of GDP under the House plan and remains high under the Senate plan. The chart also shows where revenues will be as a share of GDP under the two proposals in 2023: 19.1% for the House and 19.8% for the Senate.
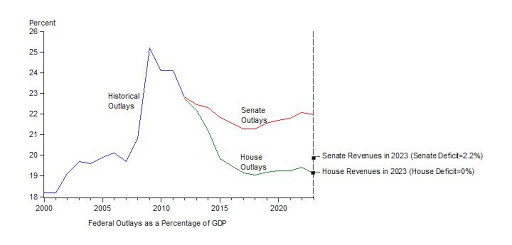
So the obvious differences between the plans are that the Senate would (1) tax more than the House by .7% of GDP, (2) spend more than the House by 2.8% of GDP, and (3) run a deficit larger than the House by 2.1 percent of GDP, where the percentages are based on 2023. Thus the bigger differences are in higher spending and larger deficits. In my view the House proposal is superior on all three counts especially given the sharp increase in spending in the past few years and the steady gradual reversal in the House plan as a share of GDP.
It is anyone’s guess where the President’s budget and spending path will appear on this chart when it is submitted. In any case the debate over these two paths during the next few weeks will largely determine what the final budget agreement is.


