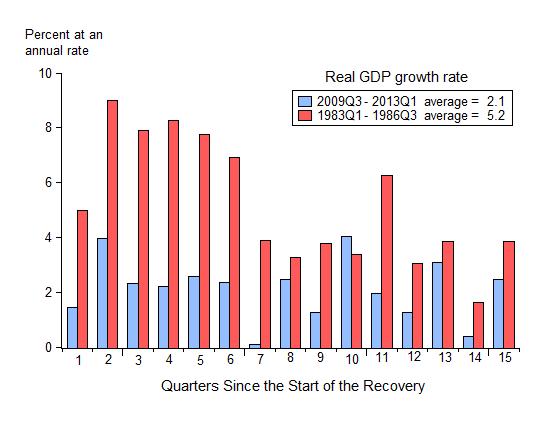
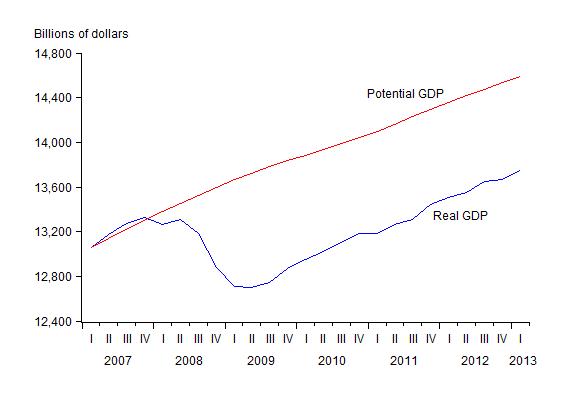
The updated charts below incorporate last Friday’s release of the first quarter GDP data. They continue to tell the story of a weak recovery which, in my view, is largely due to ineffective government policy interventions. There is, of course, an alternative view: that the recovery is weak because the recession and the financial crisis were severe.
This alternative is based on research by Carmen Reinhart and Kenneth Rogoff claiming that weak recoveries typically follow deep recessions and financial crises. That claim is frequently cited by government officials as the reason why policy has not been the problem. To be sure this is not the widely-cited research by Reinhart and Rogoff on the debt-growth nexus which has generated so much controversy recently (including a parody on the Colbert Report), but it’s quite related from a policy perspective and equally controversial.
Much as Thomas Herndon of the University of Massachusetts found problems with the “debt growth nexus” result, economic historian Michael Bordo of Rutgers found problems with the “weak recovery is normal” result. Bordo wrote about his findings (which are based on his joint research with Joe Haubrich of the Cleveland Fed) in a September 27, 2012 Wall Street Journal article, “Financial Recessions Don’t Lead to Weak Recoveries.” In discussing the view that weak recoveries follow deep recessions, Bordo wrote that “The mistaken view comes largely from the 2009 book This Time Is Different, by economists Carmen Reinhart and Kenneth Rogoff…” and he then showed that U.S data disprove that view. (I wrote about this here and here).
An important question for public policy is why Bordo’s discovery got so much less press attention than Herndon’s. Maybe Bordo’s historical research is inherently less interesting than Herndon’s discovery of spreadsheet error (it’s certainly harder for Stephen Colbert to parody), but another reason is that Herndon’s findings support more fiscal stimulus and less consolidation–still popular in some quarters–while Bordo’s findings don’t.
Here are the charts: