The One Hundred Trillion Dollar Note and Other Visual Aids

Patrick McGroarty and Farai Mutsaka have a great article in the Wall Street Journal about this famous one hundred trillion dollar note from Zimbabwe,including the fact that I carry one around in my wallet everywhere I go. Whenever someone says inflation is not caused by central banks printing too much money, I pull out this note and tell the story of Zimabwe’s hyperinflation. Although Paul Ryan and I collaborated on an oped on monetary policy recently, we did not coordinate on this use of the famous note.

If you are interested in relating this story to the Fed, I recommend adding a couple of other pictures including this photo of a QEIII license plate in Washington DC and the photo of $5 a gallon gasoline. I think these may have helped Fed rethink the idea of going beyond QEII.

Posted in Monetary Policy | Comments Off on The One Hundred Trillion Dollar Note and Other Visual Aids

Bringing Gadhafi’s Money to Rebels Recalls Bringing Saddam’s Money to Iraqis

The plan to use Moammar Gadhafi’s frozen assets to fund the Libyan rebels faces legal obstacles according to this weekend’s Wall Street Journal story “Obstacles Loom on Path To Funding Libyans.” This reminds me of the plan to use Saddam Hussein’s frozen assets to fund payments to the Iraqi people in 2003. The plan was developed before the military invasion and was part of an overall plan for financial stability. I was Under Secretary of Treasury with responsibility for the plan. Legal obstacles arose then too, and we had to develop legal procedures to deal with them.

Treasury lawyers determined early on that the President of the United States could legally issue an executive order calling on U.S. banks to vest Hussein’s frozen funds with the Treasury, which would then transfer them to the Iraqis. But an obstacle was the risk of law suits from Saddam’s victims, who could make claims on the funds, prevent their transfer, and thus threaten the financial stability plan. To deal with this risk, we recommended that the executive order contain an exception for such victims—but only if they had already made claims—and that the order state that using the frozen funds for the Iraqi people was in the interest of the United States.

So when the military operation began, President Bush issued Executive Order 13290, “Confiscating and Vesting Certain Iraqi Property,” saying that “All blocked funds held in the United States in accounts in the name of the Government of Iraq, the Central Bank of Iraq, Rafidain Bank, Rasheed Bank, or the State Organization for Marketing Oil are hereby confiscated and vested in the Department of the Treasury, except for the following….” The exception was for funds already claimed in a legal suit. The executive order also stated that “I [George W. Bush, the President of the United States of America] intend that such vested property should be used to assist the Iraqi people and to assist in the reconstruction of Iraq, and determine that such use would be in the interest of and for the benefit of the United States.”
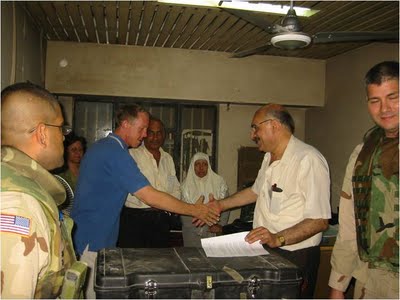
Once the order was issued we opened an account at the New York Fed where Bank of America, JP Morgan Chase, and other banks transferred about $2 billion of Saddam’s previously frozen funds. The Treasury then withdrew the funds as needed. Cash was removed from the Fed’s warehouse in New Jersey, placed on armored trucks, shipped to Andrews Air Force Base, loaded on planes, flown to Iraq, and paid to Iraqis. I recall how Treasury staff went down to Andrews to inspect the first cash transfers. When they returned to report that the cash was airborne, they radiated well-deserved pride at their accomplishment. The picture shows David Nummy (blue shirt) of Treasury dispersing the cash (in the black box) to the Iraqis in Baghdad.

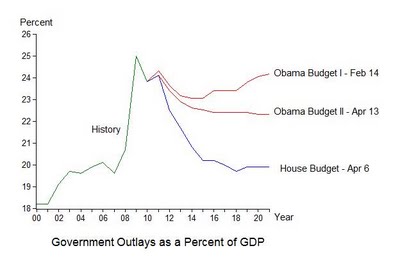
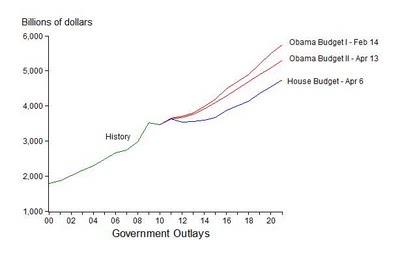
There are differences today—Saddam Hussein’s funds were frozen years before during the first Gulf war, but the legal procedures remain relevant. To overcome such obstacles, President Obama would have to say something like “I determine that using the funds to assist the Libyan rebels is in the interest of the United States.”

Posted in International Economics | Comments Off on Bringing Gadhafi’s Money to Rebels Recalls Bringing Saddam’s Money to Iraqis

New Study Questions Justification For Quantitative Easing

Proponents of Quantitative Easing frequently cite—inappropriately in my view—the Taylor Rule as support, saying that the rule calls for a federal funds rate as low as minus 6 percent, well below the zero bound. But in various pieces over the past year, such as Taylor Rule Does Not Say Minus 6 Percent, I have argued the contrary. If you simply plug in current inflation and output (gap) you will find that the interest rate is above zero with the policy rule coefficients I originally derived. But QE II proponents change the coefficients. Frequently they use a higher coefficient on output (around 1.0) rather than the lower coefficient (0.5) which I originally recommended. The higher coefficient on output gives a much lower interest rate now and is thus used by proponents of quantitative easing.

A new paper by Alex Nikolsko-Rzhevskyy and David Papell provides important evidence relevant to this debate. They show that, if history is any guide, the higher coefficient would lead to inferior economic performance compared with the original coefficient I recommended.

First, they look at the 1970s when monetary policy was too easy: in much of this period the interest rate was too low creating high inflation and eventually high unemployment. They show that the higher coefficient on output would have perpetuated the bad policy while the lower coefficient would have prevented it.

Second, they look at years in the 1990s when monetary policy is widely viewed as good, helping to create a long expansion. Here they show that the higher coefficient would have prevented this good policy. Actual policy was more consistent with the lower coefficient which I had proposed.

In sum, they find no reason to use a higher coefficient, and that the lower coefficient works better. David Papell’s guest blog yesterday on Econbrowser nicely puts these new results into the context of today’s policy debate and provides more details. He emphasizes that his paper with Nikolsko-Rzhevskyy does not endeavor to estimate the impact of QEII, but rather shows that the typical policy rule rationale for this discretionary action is flawed. In my view it is an example of “discretion in policy rule’s clothing.”

Posted in Monetary Policy | Comments Off on New Study Questions Justification For Quantitative Easing

How to Avoid the New Bailout Authority

Title II of the Dodd-Frank bill, which creates a new orderly liquidation authority for financial institutions, has recently come under fierce attacks from a variety of perspectives. Paul Ryan writing in the Wall Street Journal on April 5 argues that we should get “rid of the permanent Wall Street bailout authority that Congress created last year.” Then, after reading an FDIC report on how Title II would have worked in the case of Lehman, Simon Johnson in effect agrees with Ryan arguing that any Treasury Secretary, at least one in the Paulson-Geithner mold, would go right around Title II and simply bail out the creditors of large financial firms as in 2008. Recently Stephen Lubben has piled on in The FDIC’s Lehman Fantasy and Michael Krimminger (FDIC General Council) finally replied.

Missing from the recent debate is the role of a possible amendment to the bankruptcy code to deal with large financial firms. An amendment could supplement—or even replace—the orderly liquidation authority of Dodd–Frank and deal with the problems raised by Paul Ryan and Simon Johnson. One such amendment has been proposed by a group of lawyers, economists and financial institution experts sponsored by Stanford University’s Hoover Institution. The amendment is called “Chapter 14,” because this is currently an unused chapter number in the U.S. Code on Bankruptcy. Last week we (I’m a member of the group) presented the idea to Michael Krimminger at the FDIC and to the legal staff at the Fed which is responsible for a mandated study of the bankruptcy code. The idea is explained here.

In brief, the problems with the new orderly liquidation authority, at least in the absence of a new bankruptcy process, is that it increases uncertainty, raises constitutional due process issues, increases the probability of bailouts, and creates moral hazard. Chapter 14 would give the government a viable alternative to Title II and thereby avoid these problems. We argue that government officials would likely find Chapter 14 more attractive than Title II, or a more direct bailout, and thereby choose this option. So with such an alternative, bailouts would be less likely. As George P. Shultz puts it, “Let’s write Chapter 14 into the law so that we have a credible alternative to bailouts in practice.” Compared with Title II, Chapter 14 would more predictable and rules-based and it would minimize spillovers to the economy. It would also permit people to continue to use the company’s financial services—just as people continue to fly when an airline company is in bankruptcy.

Chapter 14 would differ from current bankruptcy law in Chapter 7 and Chapter 11. It would create a group of “special masters” knowledgeable about financial markets and institutions; a common perception is that bankruptcy is too slow to deal with systemic risk situations in large complex institutions, but under the proposal there would be capacity to proceed immediately. In addition to the typical bankruptcy commencement by creditors, an involuntary proceeding could be initiated by a government regulatory agency, and the government could propose a reorganization plan—not simply a liquidation. An advantage of this approach is that debtors and creditors negotiate with clear rules and judicial review throughout the process. In contrast, the orderly liquidation authority is less transparent with more discretion by government officials and few opportunities for review.

Posted in Financial Crisis | Comments Off on How to Avoid the New Bailout Authority

A Morale Booster for the Financial Front Too

Anyone who has served in the military during the nearly ten years since 9/11 must feel a sense of closure with Bin Laden’s death. As Lindsay Wise writes in the Houston Chronicle “Bin Laden’s death is a dramatic morale booster for those who served in the war on terror, now aptly dubbed The Long War.” The demise of Bin Laden marks an important victory to which all who served contributed in one way or another. A Marine who signed up just after 9/11 said this to me just after President Obama’s announcement: “It feels kind of like I can come home again,” but then, after a pause, “I guess we have a few more things to do.” An email was circulating around Stanford yesterday saying: “Congratulations to all Stanford veterans who laid the groundwork for this momentous occasion. Thank you for your service and your sacrifice.”

I think thanks are also due to the people who served in the financial front of the war on terror during these ten years—many in the United States Treasury. President Bush announced the terrorist asset freezing operation in the Rose Garden on September 24, 2001. It was before military actions in Afghanistan. It was the first shot in the war on terror. The announcement sent an important message to the terrorists and to the people at Treasury who were just entering to the fight. He said,

“Today, we have launched a strike on the financial foundation of the global terror network. Make no mistake about it, I’ve asked our military to be ready for a reason. But the American people must understand this war on terrorism will be fought on a variety of fronts, in different ways. The front lines will look different from the wars of the past….It is a war that is going to take a while. It is a war that will have many fronts. It is a war that will require the United States to use our influence in a variety of areas in order to win it. And one area is financial.”

Soon thereafter the G7 finance ministers released a statement pledging to work together to “freeze the funds and financial assets not only of the terrorist Usama bin Laden and his associates, but terrorists all over the world” setting off what turned out to be the most impressive effort in international coordination in the finance area in history. Soon financial intelligence networks were set up to get information about the terrorists, and new financial tools began to be used as a weapon against proliferation. To solidify these efforts a new position of Under Secretary of the Treasury for Terrorism and Financial Intelligence was created in 2004, and Stuart Levey was appointed to the position by President Bush. Stuart was asked to continue by President Obama, and only recently stepped down. Senator Kaufman’s praise on the Senate floor for Stuart and others in the Treasury shows why thanks are in order.

Posted in Teaching Economics | Comments Off on A Morale Booster for the Financial Front Too

YouTube Assignment for Macroeconomics Students

As a respite from comparing the “Keynesian cross” versus the “dynamic stochastic general equilibrium” model, watch this “Keynes” versus “Hayekvideo with lyrics written by John Papola and my colleague Russ Roberts. But my favorite lines are more micro than macro:
Keynes: “Even you must admit that the lesson we’ve learned is that more oversight’s needed or else we’ll get burned”
Hayek: “Oversight? The government ‘s long been in bed with those Wall Street execs and the firms that they’ve bled.”

Posted in Teaching Economics | Comments Off on YouTube Assignment for Macroeconomics Students

Spending Rise Has Much To Do With Policy

  • The running debate between Paul Krugman and me is bringing more facts to bear on important budget and policy issues. Since I wrote my reply yesterday to Krugman’s criticism of my Wall Street Journal article, he has responded three times, with Taylor Digs Deeper, 2021 and All That, and One More Point about 2021.
  • Krugman now admits that spending as a share of GDP would rise from 19.6 percent of GDP in 2007 to around 24 percent in 2021 under the budget proposed by the Administration on February 14, which is what I showed in my original graph.
  • And since spending averages around 24 percent of GDP in 2009-2011, this confirms my point that “Mr. Obama, in his budget submitted in February, proposed to make that spending binge permanent.” Krugman also reports some of the components of the rise in entitlement spending, showing that Social Security, Medicare, and Medicaid spending rise as a share of GDP under Obama’s proposal.
  • But Krugman now argues that “the great bulk of this projected rise has nothing whatsoever to do with Obama’s policies.” This is wrong on two accounts.
  • First, in proposing his February 14 budget, Obama chose policies that did not control the growth of spending by enough to prevent an increase in spending as a share of GDP, even though he could have chosen such policies. In fact, the policies he chose for his second budget on April 13 did impose such controls including “setting a more ambitious target of holding Medicare cost growth per beneficiary to GDP per capita plus 0.5 percent beginning in 2018” (White House Fact Sheet April 13). These recent spending controls were proposed after the House budget proposal was put forth, and they take spending in the direction proposed by the House. That Obama’s second budget has lower spending than the first demonstrates that the rate of spending increase has very much to do with Obama’s policies.
  • Second, the Obama budget does propose new spending programs, including the new health care law. And there is a step increase in entitlement spending as a share of GDP in 2009-2011 which goes beyond what would be expected from the recession, and spending remains at the higher level through 2021. If demographic changes were the only reason for the increase in spending as a share of GDP, then you would not see such a step increase.
  • In the latest post on this subject, Krugman expands his criticism to include Senators Corker and McCaskill. Here Krugman admits that the rate of increase in government spending is affected by Obama’s policies, but he now gives reasons “why federal spending shouldn’t stay at or near the share of GDP it was at in 2007” arguing that Obama should not choose such policies. I disagree. Even with current demographic projections it is possible to institute good reforms which keep Medicare and Medicaid from rising so rapidly as a share of GDP and also deliver better health care services. And of course it is possible also to reduce other types of spending as a share of GDP, including national defense.
Posted in Fiscal Policy and Reforms | Comments Off on Spending Rise Has Much To Do With Policy

Paul Krugman Versus Budget Facts

  • Yesterday Paul Krugman, citing Brad DeLong’s post earlier in the day, joined the commentary on my Wall Street Journal article of Friday which I further discussed in my blog of Sunday. Krugman takes issue with my statement that “Mr. Obama, in his budget submitted in February, proposed to make that spending binge permanent” and instead claims to see no “huge expansion of the federal government” once one takes account of the slowdown in nominal GDP growth due to the recession.
  • Krugman is wrong. The Administration’s budget did propose spending levels which make the recently increased rate of government spending as a share of GDP permanent, regardless of the reason for the recent increase. If you want to see this in a way that takes account of changes in nominal GDP growth related to the recession, then you can compare actual spending before the effects of the recession began with proposed spending after the effects of the recession are over. For all of 2007, spending was 19.6 percent of GDP. For all of 2021—after the impacts of the recession and the final year of the budget window—the budget submitted in February proposed spending equal to 24.2 percent of GDP. These two budget facts are part of the data presented in my Wall Street Journal chart and are taken directly from CBO tables. The 4.6 percentage point increase represents $1 trillion more federal spending per year at 2021 levels of GDP.
  • Much of the increase comes in the form of mandatory spending. Using the CBO baseline of January 2011 (which is below the February budget), mandatory spending would increase from 10.4 percent of GDP in 2007 to 14.0 percent of GDP in 2021.
  • DeLong mainly quotes from another post which focuses on the increase in spending during the Bush Administration. But in the Wall Street Journal I said explicitly that spending increased from 18.2 percent of GDP in 2000 (at the end of the Clinton Administration) to 19.6 percent in 2007, and my chart shows that spending started increasing more rapidly in 2008. The increase in 2008 was in part due to the stimulus package passed in February of that year; I have been critical of that stimulus package as I have been of the discretionary fiscal actions taken in 2009. My critique of policies leading up to the financial crisis Getting Off Track: How Government Actions and Interventions Caused, Prolonged and Worsened the Financial Crisis was written before any policies were enacted by the Obama Administration.
Posted in Budget & Debt | Comments Off on Paul Krugman Versus Budget Facts

Notches and Disincentives in the Health Care Law

My colleague Dan Kessler writes in today’s Wall Street Journal that Obamacare creates large disincentives to work. I’ve found the following graph useful for showing students why. (The same type of graph is used in of my economics text Chapter 14, p 4o4) 
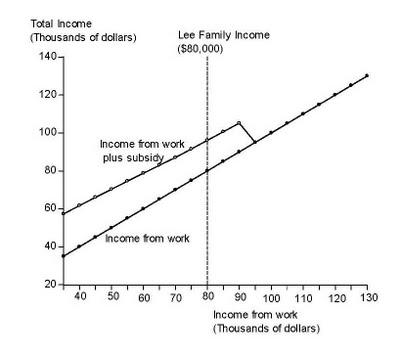
The graph shows income from work and the corresponding health care subsidy for a family of 4 headed by a 55-year old. The subsidy is paid to households earning up to 400 percent of the poverty line. With a poverty line of about $23,300 for a family of 4 in 2014 (when the legislation goes into effect) families earning as much as $93,200 will get a subsidy.

Observe how the subsidy declines with income and then is slashed to zero when 400 percent of the poverty line is hit. You can even see the V-shaped “notch” in the graph, which has become the technical term used to describe such sudden drops in subsidies. Consider the Lee family, for example. They earn $80,000 and thus get a subsidy of $16,100, bringing their total income to $96,100. But suppose they decide to work more. If they increase their income from work by $14,000, bringing their work earnings to $94,000, then their health care subsidy drops to zero. So they get less income by working more, and that’s a big disincentive.

Posted in Regulatory Policy | Comments Off on Notches and Disincentives in the Health Care Law

On the Budget Debate People Are Saying “All We Want Are the Facts”

  • This graph from my Friday Wall Street Journal article simply presented basic facts about the second Obama budget and compared it with the first Obama budget and with the House budget.
  • So why did it attract so much attention here and here and other places? I think it’s a sign that people are tired of rhetoric and demagoguery. They want to understand each side’s factual position in the debate. “All we want are the facts, ma’am,” as Joe Friday would say. My guess is that people would like it if President Obama or Members of Congress took one or two charts to the town hall meetings or to the Sunday morning talk shows. Sometimes you hear the excuse that charts are too technical, but that certainly doesn’t apply to the techies at the Facebook town hall last Wednesday.
  • Still some have asked good questions about how to interpret my chart. Some thought it is misleading to plot government spending as a percent of GDP. But that’s not unique to my chart, and in fact it’s pretty conventional. CBO and OMB regularly report spending this way. For example this recent CBO report on the first 2012 Obama budget measures outlays as a share of GDP (See Table 1-2 on page 4). Regarding recent history Table E-2 of this CBO historical data set presents the history of outlays as a share of GDP both before and after the recession. The point of my article is that there was a spending binge and that the binge would continue with the Administration budgets, and I think the chart showed that accurately.
  • Here is what my chart looks like if you do not divide spending by GDP. It reminds us that the under the House budget spending continues to grow, but less rapidly than the two Obama budgets. You can still see the spending binge of the past few years but the upward trend makes it harder to visualize.
  • Another question is why I did not include zero percent of GDP in scale of the chart. I teach Economics 1 students at Stanford to look at the scale of axes carefully, but I do not think it is misleading to choose the scale I did. If you are interested in what is happening to the stock market in the past few months, you do not plot the S&P 500 with a chart that includes zero. If you did you would not see much of anything on a day to day basis. For the record here is a version of my budget chart which includes zero. The story is the same, but the ups and downs are scaled down and are harder to see.
Posted in Budget & Debt | Comments Off on On the Budget Debate People Are Saying “All We Want Are the Facts”