Valuable Dissent to the Transportation Research Board’s Special Stimulus Report

This past week the Transportation Research Board released its Special Report from the “Committee on Economic and Employment Benefits of Transportation Investments in Response to Economic Downturns.”  The report evaluated the 2009 stimulus and in particular the part of the stimulus that provided grants to states for transportation infrastructure. The Transportation Research Board is part of the National Research Council, the principle operating agency of the prestigious National Academy of Sciences and National Academy of Engineering.

The report has two main parts, the first on fiscal stimulus packages in general and the second on the design and workings of the 2009 stimulus. The design part usefully examines a number of practical problems with the stimulus, such as the “maintenance-of-effort” requirements in which the states were supposed to maintain expenditures of state funds so that the federal stimulus grants (ARRA) would not simply replace state funding.  In practice the states and federal government experienced many difficulties in “interpreting, administering, and complying with ARRA’s maintenance-of-effort requirement” the Committee reports.

Based on this experience the report makes recommendations on how to avoid such problems if another stimulus is considered in the future. It’s a concern, however, that the report does not examine why similar lessons from previous discretionary stimulus packages, such as the stimulus packages in the 1970s studied by Ned Gramlich and others, were not sufficiently reflected in the design of the 2009 package. Perhaps there are real feasibility problems with such stimulus packages.

But a greater concern pertains to the first part of the report which does not accurately characterize the existing evidence on discretionary fiscal stimulus packages. The report argues that “the preponderance of studies support the conclusion that federal stimulus spending, during a recession or period of high unemployment and when monetary policy is maintaining low interest rates, leads to an increase in gross domestic product (GDP) and in employment, at least in the short term (within 1 or 2 years after the spending)….Research based on experience since 2008 tends to support values of the multiplier above 1 as applicable when unemployment is severe and interest rates are being held near zero.”

Having done research on this topic since 2008 I noticed that the report fails to refer, for example, to a 2009 study by Cogan, Cwik, Wieland and me (CCTW), later published here, which found multipliers below 1. This was one of the first model-based calculations of the government purchases multiplier for the 2009 stimulus.  Nor does the report refer to the calculations reported by numerous economists at research departments at central banks and international financial institutions, who largely came to the same conclusion as CCTW.

Fortunately, one of the Committee members, Bill Dupor, who refused to go along with the Committee’s report, has written a thoughtful statement explaining these and many other concerns about the report.  His dissenting statement is found in Appendix B of the report. Bill Dupor has done a lot of original research on the 2009 stimulus package and he knows as much as anyone about the program, the data, the models, and the econometrics.  He raises a number of issues and provides data not included in the body of the report. For example, he points out that despite the enormous scale of the federal stimulus grants there was no visible impact on employment, which by one important measure declined as shown in this chart from his statement.

Dupor Chart


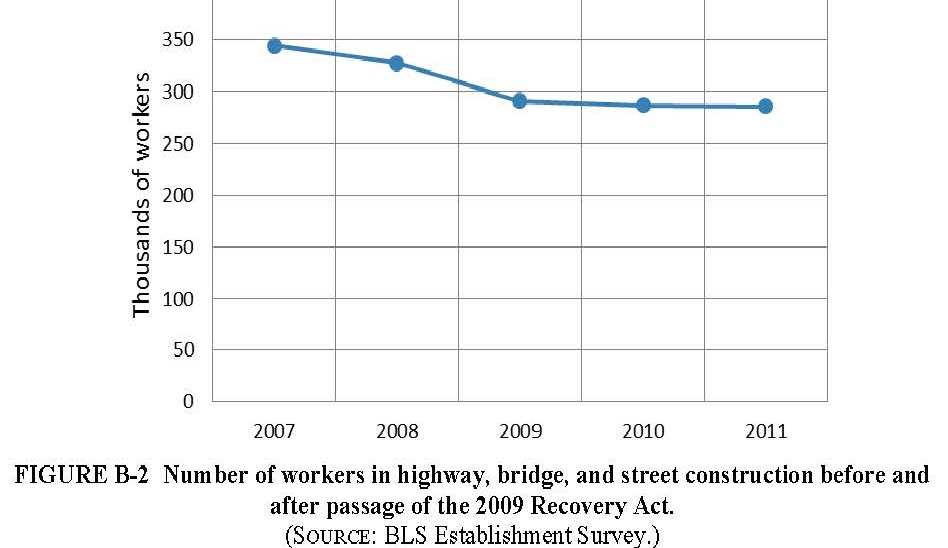
One can always say that things would have been worse without the federal grants, but the scale of the grants was so large that this explanation of the figure is hard to take seriously. Dupor’s explanation for the lack of a larger impact from the grants is that many states found other things to do with the funds, which is similar to the conclusion of John Cogan and me in another paper (see p 85-114 of this book on line).

Considering these impacts and the difficulty of any design changes in our federal system, Bill Dupor concludes: “Weighing these factors together, I suggest that policy makers consider not using stimulus spending at all regardless of category,” adding that “economic theory permitted economists to foresee some of the problems with the Recovery Act beginning decades ago.”  I agree.

Posted in Stimulus Impact | Leave a comment

Will the Real “Secular Stagnation Thesis” Please Stand Up

Last Thursday I published an oped in the Wall Street Journal criticizing the new “secular stagnation” view as put forth by Larry Summers in a talk at an IMF conference in November. The topic was also the focus of debate at a session in which Larry and I appeared over the weekend at the AEA meetings with Marty Feldstein, Dale Jorgenson, and Ed Prescott.  At the heart of Larry’s thesis is the view that there has been a secular decline in the past decade in the “real interest rate that was consistent with full employment,” and that decline is what I addressed in the oped. (I also gave a paper at the meetings with my views on the subject.)

In the meantime, Jared Bernstein decided that my oped was “worth a brief response” because it goes “after an argument that has resonated with many in recent weeks: secular stagnation.”

A number of people have asked me about Jared’s response. But to my surprise, I see that he does not even mention the decline in the equilibrium interest rate which is at the heart of the view that Larry put forth.  So Jared’s response has missed the main point of the argument between Larry and me, and I’m disappointed that there’s not much to respond to in that regard.

Rather Jared seemed to be defending another secular stagnation thesis.  Apparently it’s a thesis that he has talked about, as he puts it, “for years under the rubric of slack labor markets, which have led to diminished bargaining power and stagnant real earnings for many in the workforce.  It is also a contributor to increased inequality.”  I did not address this thesis in my oped. But in trying to defend it, Jared throws out several incorrect and misleading statements about my policy evaluation research.

First, my criticism of policy does not pertain only to policy in the post 2008 period as Jared suggests. It is a critique that includes fiscal, regulatory, and monetary actions taken from 2003 through 2008 as well as from 2009 to the present.”  Second, I am not trying to disprove, as Jared also suggests, that the economy did “better in the 1990s” than in the past decade . Indeed, in my view, economic performance during the 1980s, 1990s and early 2000s was better than in much of the past decade. 

Posted in Slow Recovery | Leave a comment

Catching Up On Some Hot Debates Over Monetary Policy

There have been a flurry of debates and discussions about monetary policy in December, and people have been emailing and tweeting me asking for the links.  So here are:

— some links to segments (with some overlap) produced by CNBC of the debate between Alan Greenspan and me, which Larry Kudlow moderated on his TV show: (1) Debate follows opening question about Taper  (2) Rates were too low: Taylor (3) Greenspan defends his record with text by Krista Braun

— a link to what turned out to be a debate between Adam Posen and me with David Wessel in the middle on PBS NewsHour.  The Taper and the performance of monetary policy during the Bernanke years were the topics.

— a link to five WSJ essays online with different takes on what history will say about the Bernanke years

– a link to a fun discussion with Rick Santelli (following his Treasury auction report).

Posted in Monetary Policy | Leave a comment

Clarifying Some Key Taylor Rule Calculations

Justin Lahart has an article in the Wall Street Journal today about the Taylor Rule and the time inconsistency of the Fed’s forward guidance. I agree with the spirit of the piece, but unfortunately the article misquotes the Taylor rule which has caused some confusion.

Justin writes that “John Taylor’s original framework says that the target [federal funds] rate should be 1.5 times the inflation rate plus .5 times the output gap.” However, as I wrote on this blog in 2010 and in many other places over the years, “The Taylor rule says that the federal funds rate should equal 1.5 times the inflation rate plus .5 times the GDP gap plus 1.” So Justin omitted the “plus 1.”   The “plus 1” is very important. It means that the target inflation rate is 2%, which is what I recommended 20 years ago and is now what the major central banks use.  You can see this by noting the equivalence of the two equations on the slide below which I use in my Economics 1 course at Stanford. (If you omit the “plus 1” you are implicitly assuming the target inflation is 4%).  In 1992 I wrote the equation in red oval, which is the same as the one in the blue oval

TR slide

It is interesting that Jutin gets the right answer for the funds rate even though he misquotes the rule: If you plug in Justin’s inflation rate (1.2%) and gap (3%) into his statement of the Taylor rule, you get 0.3 %. But he says he got 1.3%.  So he must not have omitted the “plus 1” when he did the math even though he omitted it in the article.

Posted in Monetary Policy | Leave a comment

Response to an Email about QE and a Letter

Recently I received an email with this question about my views on quantitative easing and a letter I signed with others: “I have a question about the letter you signed back in 2010 asking the Fed not to do QE2. That letter said QE2 risked currency debasement and inflation, and wouldn’t help employment. Do you still believe that? If so, how do you think this will be borne out? And if not, what’s changed your mind?” and I responded with this email:

Thanks for your email about QE. I have been concerned about the adverse effects of QE since 2009, and to answer your question it will be helpful for me if I could review some of my research and writings since then.  Here is congressional testimony from February 2009 where I listed some risks of the policy as conceived then; these were two-sided, some—mostly shorter run, were about lower growth and higher unemployment, others—mostly long run, were about inflation and loss of Fed independence.  I also did some of the earlier empirical studies on QE, which I reviewed in this lecture and later published with Johannes Stroebel. Most of these had to do with the either the ineffectiveness or counter-productiveness of the policy in boosting the recovery.  I also listed in this post several articles or blog pieces I wrote before the QE letter, which give more facts and details.

I believe that QE has had, and still has, two-sided risks.  The low growth and employment risks have turned out to be much as I warned about.  The recovery is much weaker than the Fed expected with these polices.  In fact, the events of last May and June made the unwinding uncertainty obvious to just about everyone. The currency and inflation risks are still there too, but they depend on whether the Fed will in fact unwind, and they have been delayed by the weak recovery, which is in part due to the policies.

I described these issues briefly in a response to Paul Krugman a few days ago: “Regarding the current unconventional monetary policy, I have long argued that it creates a two-sided risk: the risk of lower growth and the risk of higher inflation. Thus far the realized risk has been low economic growth with high unemployment. In my view, poor economic policy has been to blame.”

I am sorry that this is such a long response, but to summarize, in my view QE unfortunately did not help employment or growth. And, also unfortunately, it still risks inflation down the road unless the Fed can find a way to gradually unwind. And that unwinding creates more risks.

Very Best Regards,

John

Posted in Monetary Policy | Leave a comment

Two Amazing Charts

Research by Christopher Erceg and Andrew Levin is providing solid evidence that the decline in the labor force participation rate since 2007 has been due to cyclical factors–the recession and slow recovery–rather than to demographic factors.  In other words, the fact that such a large number of people have dropped out of the labor force is associated with the weak economy rather than to their reaching their retirement years–or some other typical demographic trend.  Because the unemployment rate does not count the people who dropped out of the labor force it no longer gives a good reading of the state of the labor market. The unemployment rate would be much higher without this large decline in labor force participation.

In the latest version of their paper Chris and Andy estimate how large the US unemployment rate would be without this abnormal decline in the labor force, and they produced this amazing chart which summarizes their findings (I tweeted about this yesterday).

ErcegLevin_26aug2013 Fig 6 right

That the actual unemployment rate has become such a poor indicator of labor market trends is one reason why many economists have focused on the employment to population ratio.  Here is an update of a chart I have been using for several years to illustrate the lack of progress in employing the working age population compared to recoveries from previous deep recessions, such as the recovery from the recessions in the early 1980s.  It too is an amazing chart.

emppop-oct13

There is no longer debate that the labor market performance in this recovery–and the recovery itself–is unusually weak.  The debate is now over why. I have argued that it is the economic policy.

Posted in Slow Recovery | Leave a comment

Krugman’s Slack

In a piece yesterday, Paul Krugman disagrees with my assessment that there was more overheating than slack in the economy in the years leading up to the 2007-09 recession and financial crisis. That assessment was one part of a broader critique I was making of a secular stagnation hypothesis.

First, Krugman says that by using an overall GDP price index for which inflation rose during the years from 2003-2005 I am picking “whatever price index makes the point,” and thus employing “Another Taylor Rule.” No. I used an overall price index for GDP in the original Taylor Rule proposal going back two decades now. There’s no picking and there’s no new rule here.  Rather than taking out food and energy price inflation I controlled for price volatility in that rule by averaging overall inflation over time. Simply taking out food and energy price inflation can lead to policy errors especially when such inflation lasts for more than a short time. And it is not only the overall GDP price level. The CPI inflation rate was also rising, not falling, during this period.

In any case, the increase rather than a decrease in overall inflation was only one part of my assessment that this was not a slack period. I also discussed the unemployment rate—which got quite low (4.4%) rather than high as in slack periods—and the huge housing boom with high housing price inflation.

Krugman does not even consider the unemployment rate in his response, and he simply dismisses the possibility that housing price inflation running at over 15 percent per year before the crisis was a sign of excesses.  Instead he talks only about the housing bust and the downturn. But the bust followed the boom—as is so often the case. In my view, the boom and excessive risk-taking which lead to the bust was exacerbated by lax regulatory and monetary policy.

As I discussed in my 2009 book  Getting Off Track: How Government Actions and Interventions Caused, Prolonged, and Worsened the Financial Crisis “you have to look at more than inflation to assess the situation. Monetary economists have been concerned for years about the erratic nature of monetary policy, creating booms and then slamming on the brakes. Milton Friedman’s Newsweek columns were filled with that kind of complaint. In my view that has been a major problem with monetary policy in the past few years, after two decades of good systematic performance beginning in the early 1980s.”

Krugman finishes his piece by claiming that I always argue that policy is too loose.  No. I am in favor of rules-based policy, not perpetual tightness or ease. If the federal funds rate had been adjusted more promptly in 2003-2005 (following the type of rule that described policy in the 1980s and 1990s), then it would not have had to rise above 4%.  But instead it went over 5%. In this sense policy was too easy in 2003-2005 and too tight in 2006-2007.

Regarding the current unconventional monetary policy, I have long argued that it creates a two-sided risk: the risk of lower growth and the risk of higher inflation. Thus far the realized risk has been low economic growth with high unemployment. In my view, poor economic policy has been to blame.

Posted in Financial Crisis, Slow Recovery | Leave a comment

The Problem is Policy Not a Secular Decline in the Real Interest Rate

Larry Summers’ recent talk on what ails the US economy  at the November 8 IMF conference is getting a lot of attention. I first heard Larry present his argument at the October 1 Brookings-Hoover conference organized by Martin Baily and me, and it got a lot of attention at that conference too.

Here are the basic elements of the Summers argument:

  • In the years before the crisis and recession, easy money and related regulatory policies should have shown up in demand pressures, rising inflation, and boom-like conditions.  But the economy failed to overheat and there was significant slack.
  • In the years since the crisis and recession, the recovery should have been quite strong, once the panic was halted.  But the recovery has been very weak. Employment as percentage of the working age population has not increased and the gap between real GDP and potential GDP has not closed. 
  • A decade long secular decline in the equilibrium real interest rate explains both the lack of demand pressures before the crisis and the slow growth since the crisis.  This decline in the equilibrium real interest rate offset any positive demand effects of the low interest rate policy before the crisis. And, with the zero interest rate bound, the low equilibrium interest rate leaves the economy weak even with the current monetary policy.

The first point is inconsistent with some important facts.  Inflation was not steady or falling during the easy money period from 2003-2005. It was rising. During the years from 2003 to 2005, when Fed’s interest rate was too low, the inflation rate for the GDP price index doubled from 1.7% to 3.4% per year.  On top of that there was an extraordinary inflation and boom in the housing market as demand for homes skyrocketed and home price inflation took off, exacerbated by the low interest rate and regulatory policy. Finally, the unemployment rate got as low as 4.4% well below the natural rate, not a sign of slack.

I completely agree with Larry’s second point that the recovery has been weak. I have been writing about this weakness on EconomicsOne.com since the so-called recovery began. The book by Lee Ohanian and me published last year shows the distressing picture of the employment to population ratio on the cover. But the factual problem with Larry’s first point sheds doubt on the whole “low equilibrium real interest rate” explanation.

Fortunately, another explanation fits the facts. I summarized this explanation in my presentation at the Brooking-Hoover conference at which I was on the panel with Larry Summers as well as Sheila Bair and Kevin Warsh. The explanation is detailed in my 2012 book First Principles.  In my view, deviations from good economic policy have been responsible for the very poor performance over the past decade. Such policy deviations created a boom-bust cycle, and were a significant factor in the crisis and slow recovery.

Examples include the Fed’s low interest rate policy in 2003-2005 and the lax enforcement of financial regulations—both deviations from rules-based policies that had worked in the past.  These were largely responsible for the boom and the high level of risk taking, which ended in the bust in 2007 and 2008.  Other more recent examples are the hundreds of new complex regulations under Dodd-Frank, the vast government interventions related to the new health care law, the temporary stimulus packages such as cash for clunkers which failed to sustain growth, the exploding federal debt that raises questions about how it will be stopped, and a highly discretionary monetary policy that has generated distortions and uncertainty.

In sum, the view that “policy is the problem” stands up quite well compared to the view that “a secular decline in the equilibrium real interest rate is the problem.”

Posted in Slow Recovery | Leave a comment

It’s Not Doves v Hawks, It’s Rules v Discretion

For years commentators have endeavored to classify monetary policy makers into doves and hawks.  Doves are said to be more concerned with unemployment. Hawks are supposedly more concerned with inflation. And because many commentators associate easy money (however one defines that) with keeping unemployment low and tighter money with keeping inflation low, they say that A is more dovish than B if A advocates an easy money policy.

In my view this terminology is very misleading, and usually gets the relationship between policy and outcome backwards. For one thing, dovish policy by this definition often leads to higher unemployment rather than lower unemployment despite the best of intentions. We saw this happen in the 1970s when easy money policies aimed at reducing unemployment and letting inflation rise backfired and eventually led to unemployment over 10%. Similarly, the efforts to hold interest rates very low in 2003-05 helped lead to excesses in housing and risk-taking that were in part responsible for the financial crisis, which again led to an unemployment rate over 10%.  Although the jury is not out, I would argue that so-called dovish policy today (QE in particular) has added uncertainty and has not contributed to a stronger recovery.

A better way to classify and assess monetary policy makers would be based on  their position on the rules versus discretion debate, and which way they lean in practice.  There is a lot of theoretical research and empirical experience that rules-based monetary policy works better than discretion in keeping both unemployment and inflation low.  And there is a clear difference between policy makers on this dimension.

What about current and prospective policy makers? The give and take of Congressional hearings can be a good source of information—including the upcoming Senate confirmation hearings. But there are other clues.

In my book First Principles I showed how some of Ben Bernanke’s writings before joining the Fed indicated a strong aversion to rules-based strategies for the instruments of monetary policy, and I have argued that Janet Yellen is more-rules based then Larry Summers would have been as Fed chair, though she justifies the current deviation from rules by saying these are not normal times. Jeremy Stein is looking for a rules-based approach to unwinding quantitative easing, which seems sensible even if very difficult, and John Williams has generally been inclined to favor rules-based policy.  Charles Plosser has been arguing in favor of sensible rules based policies for the instruments, and has been giving practical proposals to implement such policies.

Posted in Monetary Policy | Leave a comment

Extreme Policies Are a Big Problem, Despite Naysayer

In a recent post, Paul Krugman commented on my Wall Street Journal article published this week. He tries to go after two paragraphs in particular, but misses on both. In the next to last paragraph of the article, I argue that growing federal debt, as projected by the Congressional Budget Office (CBO), is a problem, and that it “raises uncertainty about how the debt can be brought under control.” Krugman disagrees, but if you look at the CBO projections you can see that there’s plenty to be concerned about.

Here is a chart of the numbers from the latest CBO report (The 2013 Long-Term Budget Outlook) and accompanying spreadsheet (44521-LTBOSuppData) from CBO’s web page. It shows the CBO projections of debt as a percentage of GDP under the two CBO scenarios. The projection under the extended baseline scenario is shown in red. The projection under the alternative fiscal scenario is shown in blue. (The alternative fiscal projection does not go out as far as the extended baseline for the reasons given below). Both rise well above historical experience.

cbodebt2013

One might say “don’t worry” because the projected increase is a long way off under the extended baseline. But that is not the case under the alternative fiscal scenario which CBO has been using in recent years to portray a more likely outcome.

More worrisome is that these projections have changed very little since 2009, as shown clearly in the next chart.  The only real difference between the 2009 projection and the 2013 projection with the alternative fiscal scenario is that CBO has stopped reporting the numbers once they get very high.

debt 09-13

Regarding the last paragraph, Krugman simply misses the point, which is that government policies are becoming more extreme and failing, and that this is the source of the governance crisis, rather than, as is often claimed, increasingly extreme views of the critics.  As I said in my previous post on this blog, “it’s extreme policies, not extreme people

Posted in Budget & Debt | Leave a comment