Starting a decade ago, I’ve charted on Independence Day the most recent long-term projection of the federal debt by the Congressional Budget Office (CBO). Over the years the chart has continued to look much like the Fourth of July fireworks, as you can see here 2010, 2011, 2012, 2013, 2016, 2017, 2018 .
The CBO just released its 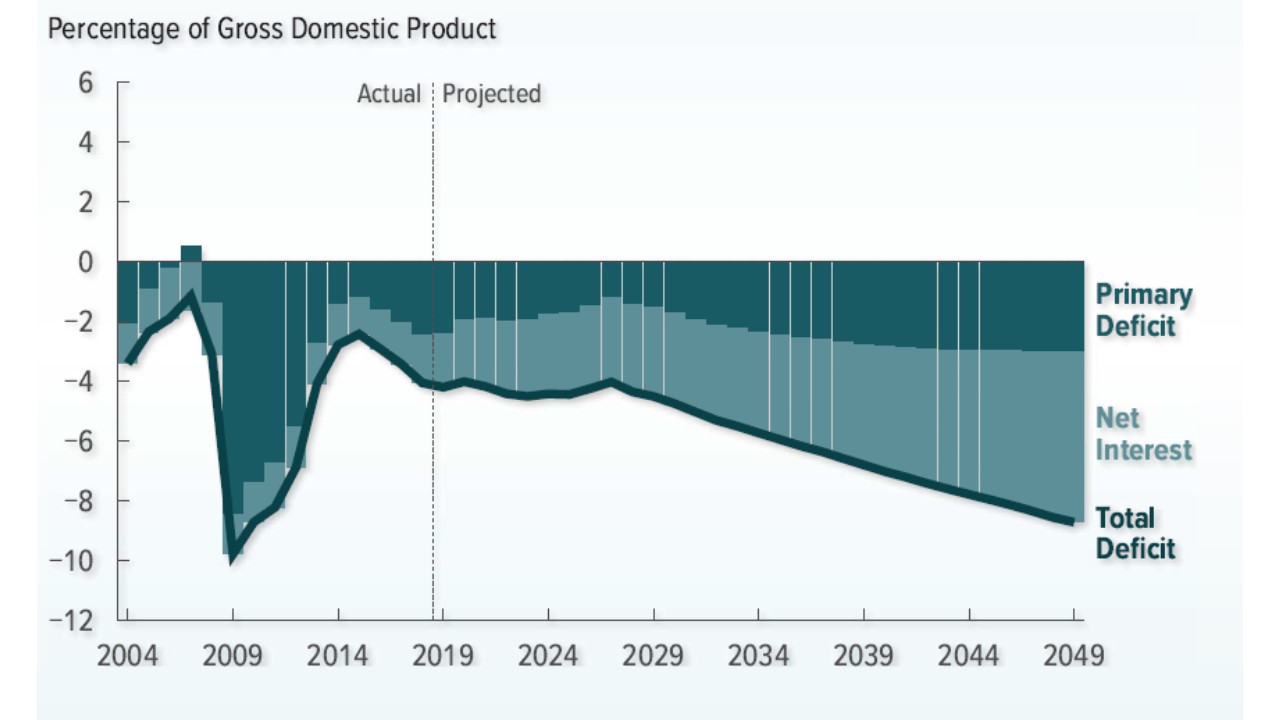 2019 Long-Term Budget Otutlook on June 25, and so it’s time for a July 4th update. The chart of the total deficit on the front cover of the report (reproduced here) is a sight to behold. As CBO says: “If current laws generally remained unchanged, large budget deficits would boost federal debt to unprecedented levels over the next 30 years.”
What about the debt? I plotted in the next chart the forecast of the debt as share of GDP (solid blue line) along with the forecast of net interest payments on the debt as a share of GDP (dashed red line) and, for comparison, the debt as a share of GDP (solid red line) as projected through 2047 by the CBO in March 2017 before the Tax Cuts and Jobs Act of 2017.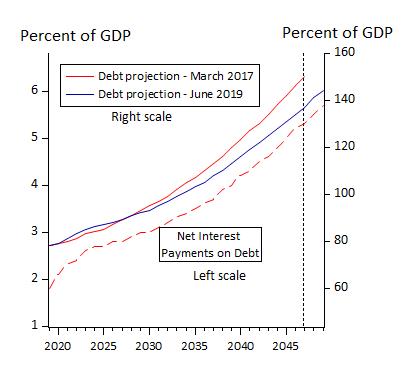
The message, like the fireworks display, is still loud and clear: The debt is exploding, and net interest payments are rising rapidly as a share of GDP. No new news here.
But there are two pieces of news in the debt chart. First, the debt is now projected to be 11 percentage points lower as a share of GDP in 2047 compared to the projection at this time last year. That’s an improvement. Second, the 2017 Tax Act did not increase the debt to GDP ratio going forward: The projected trajectory of the debt to GDP ratio is lower after the tax cut than before, except for a small increase at the start of the projection. The debt problem is still due to rising spending growth not the tax reform. Maybe less spectacular, but no reason for complacency.


