Every summer since 2010 I’ve charted the latest Congressional Budget Office (CBO) long-term projection of the federal debt, noting the similarity with the Fourth of July fireworks. But during these years, the CBO has changed its procedures several times, fogging up comparisons over time and lessons from experience.
Starting with my first post in 2010 on this topic, CBO reported projections of the debt as a percentage of GDP going out 75 years based on their “alternative fiscal scenario” which is more realistic than their “baseline scenario” that assumes no-change in current law. Here’s what CBO projections made in 2009 and 2010 looked like. 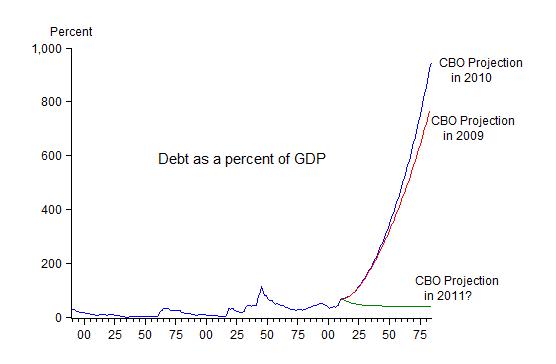 You can see the explosions clearly as the debt to GDP ratio forecast reached 767% by 2083 in the 2009 estimate, and even higher in the 2010 estimate. I also sketched in an optimistic, but sensible, idea of what could happen the next year, 2011.
Perhaps because the explosions looked so bad, CBO implemented procedural changes to make their projections look less like fireworks. First, starting with the 2011 projections, CBO stopped reporting the debt to GDP ratio once it exceeded 200 percent of GDP, which turned out to be in 2031, ending the exercise 50 years earlier than the previous projection. So, in my blog post about the the 2011 projections I had to calculate my own debt projection. 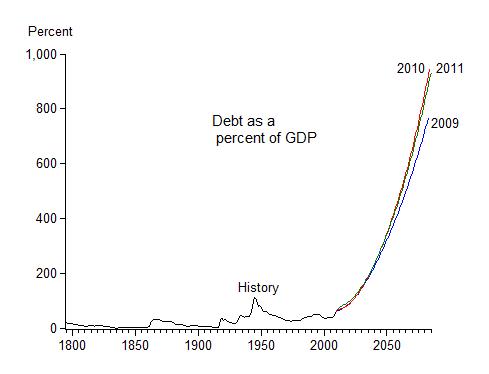 It was based entirely on CBO assumptions and is shown in this next chart, which clarified that the explosion was still there, even though CBO stopped publishing it. (As you can see the 2011 projection was not what I hoped for.)
The second CBO procedural change was to discontinue the use of the “alternative fiscal scenario” in the long-term projections which made it impossible to update my plots and make comparisons as before. So, in the 2013 post, I simply superimposed CBO’s longer-term 2009 projection on their shorter-term 2013 projection, and thereby simulated a comparison as in the next chart. 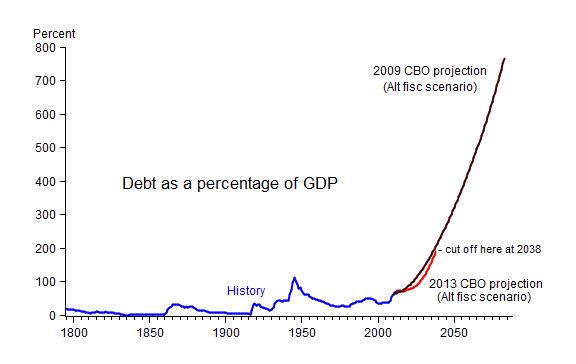 As the chart shows quite clearly, the debt picture had not improved at all.
The third change at CBO was to stop using the alternative fiscal scenario completely, and instead rely only on the “baseline scenario” which unrealistically assumes current law remains fixed.
This change was unfortunate in my view. In fact, it turns out that the “alternative fiscal scenario” has been more accurate than the “baseline scenario. To show this I compared the CBO 2010 projection of the debt for the years from 2011 to 2016 with actual debt just reported by the CBO in their March 2017 long-term budget outlook. The next chart shows how much closer the alternative fiscal scenario is to what actually transpired compared with the baseline scenario.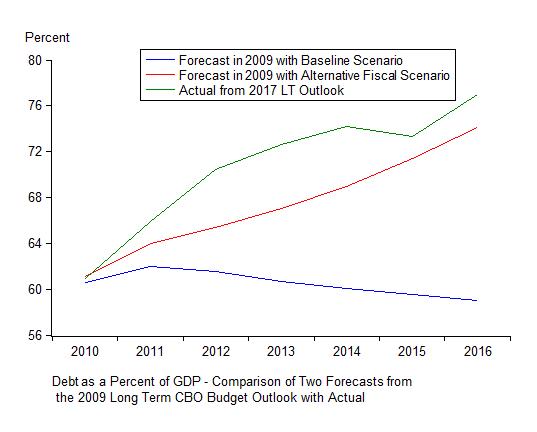
In any case, without the alternative fiscal scenario, it is not possible to continue updating and comparing the charts in an apples-to-apples fashion. Fortunately, the Committee for a Responsible Federal Budget (CRFB) has come to the rescue by filling the void left by CBO’s omission of its alternative fiscal scenario. In a recent piece, How High Will Debt Rise If Current Policy Continues?, CRFB created and reported their own alternative fiscal scenario, writing that “as we show in this piece, debt could grow far higher if policymakers continue to act as they have in recent years.”
Here is a chart from the CFRB study which helps to illustrate the differences; it goes out to 2047 and thereby shows part of the explosion. To be sure, this projection, which was done in April, does not include the impacts of already-enacted or administratively-executed regulatory changes, and clearly does not include tax reform, budget reform, and monetary reform that have been proposed. 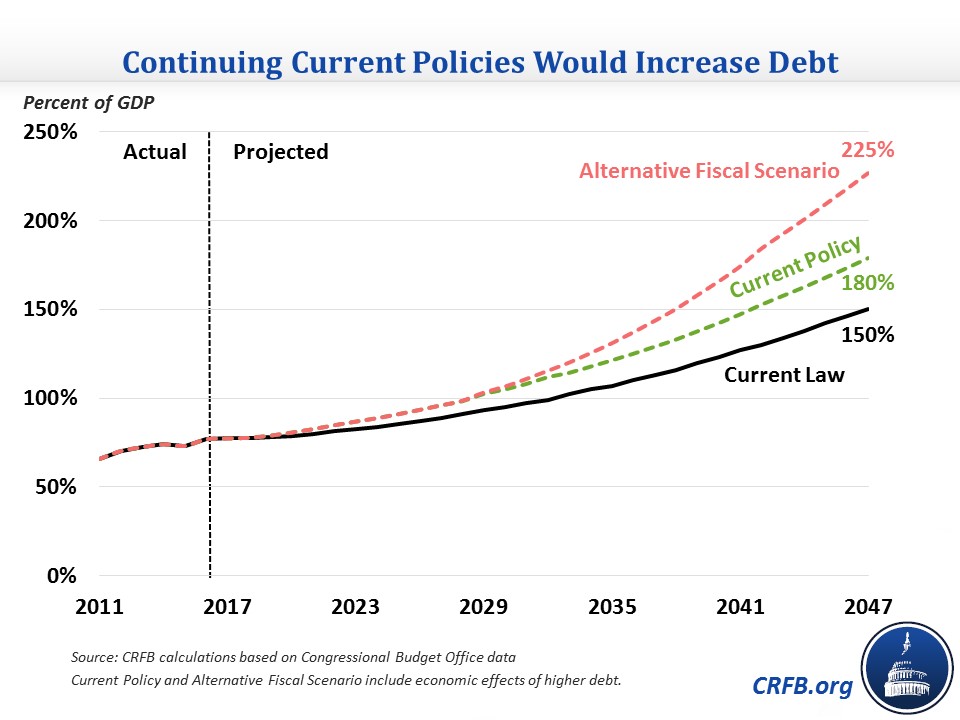 Without these reforms the explosive story is the same.
But, as I have argued for a long time, with these reforms, the budget projections and the economy would be quite different. The CBO assumes that real GDP growth will be only 1.9 percent per year during the period of its long-term budget projection, which CBO divides into 1.6% for productivity growth and 0.3% for worker-hours growth. With the changes in policy, including with the fiscal consolidation plan implicit in the chart above that recommended budget reform in 2011, growth would be higher–say 3% as I argued here with both productivity growth and labor force participation rates rising. In sum, despite the fog that may have been created by changes in CBO’s budget procedures, the history of these forecasts and the failure of policy thus far show that the economy is still like a caged eagle ready to be set free, a fine analogy for the Fourth of July.


