Six years ago, on July 4, 2010, in a post on this blog, I plotted the CBO’s projection of the ratio of federal debt to GDP because it reminded me so much of the Fourth of July fireworks. What does it look like now?
The most recent CBO long term projection was made in June of last year (CBO is later than normal this year). For some reason, however, the CBO no longer reports debt levels higher than 250% of GDP, as it did in the past, though it does publish estimates of the primary deficit (the difference between revenues and non-interest spending) under its alternative fiscal scenario through 2089. So I use those estimates and calculate the debt levels assuming that the interest rate remains at the levels forecast by CBO. 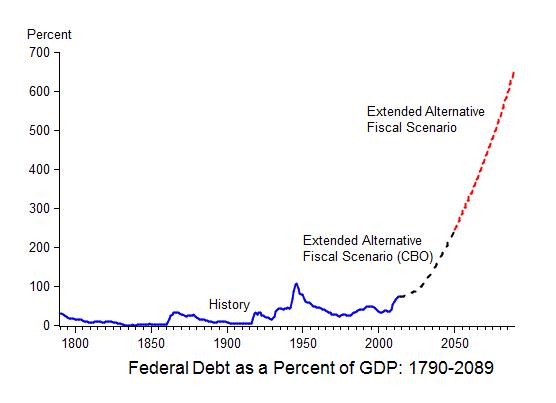
As you can see from the figure, the fireworks explosion is still there, and it looks just the same! Clearly this future debt picture is not sustainable. A fiscal consolidation—a reduction in the primary deficit—is needed if the debt explosion is to be avoided. That the debt is projected to grow relatively slowly as a share of GDP for the next 5 or 6 years has led to complacency, but the longer the fiscal consolidation is postponed the harder it will be to carry out without disruptions.
The decrease in the debt to GDP ratio in the late 1990s was largely due to a decline in defense spending as a share of GDP coupled with strong economic growth. The increase in recent years is due to the weak economy—the recession of 2007-2009 and the slow recovery. The projected increase in future years is mainly due to the rapid growth of entitlement spending compared to GDP


