On PBS NewsHour yesterday Peter Thiel argued that the opportunity cost of college may be surprisingly high for many students, and indeed, as widely reported this past week, he raised the opportunity cost for some impressive 20 Under 20 prize-winning entrepreneurs. Economist Richard Vedder was on Peter’s side of the argument, and not so surprisingly Wesleyan University President Michael Roth was not.
But the opportunity cost argument is worth taking seriously, and the entrepreneurship example is certainly a good one for the introductory economics course. Ever since Tiger Woods took my Stanford Economics 1 course in 1996, I’ve started my text book and first lecture with the story about how he dropped out of Stanford and joined the pro tour after learning about opportunity cost from me. But in the 7th Edition (out this fall) we are using examples closer to Peter Thiel’s (who also was a Stanford student).
This photo is a great visual aid for discussing opportunity cost. It shows Barack Obama along with entrepreneurs and chief executives of top technology firms: Apple, Cisco, Facebook, Genentech, Google, Netflix, Oracle, Twitter, and Yahoo. They’re meeting over dinner to talk about the economy.
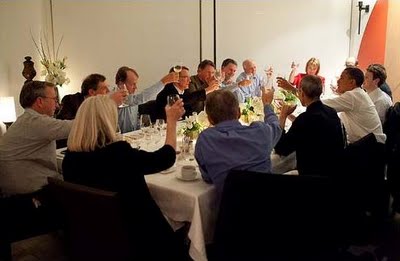
Everyone at the table has amazing stories about making choices. Mark Zuckerberg, sitting to President Obama’s right, faced a big choice when he was in college in 2004: whether to finish his degree or to drop out and devote all his time to transform a novel idea into a start-up firm. Doing both college and the start-up was not an option because time is scarce, only 24 hours in a day, not enough time to do both activities and sleep a bit. So he had to make a choice. In choosing one activity, he would have to incur the cost of giving up the other activity. Dropping out would mean passing up a college degree which would help him get a good job. Staying in college would mean he could not start up a new firm. Zuckerberg chose to drop out, and it looks like he made the right choice.
Steve Jobs, sitting to the left of the president in the photo, also dropped out of college, but it was because he felt the cost of tuition was too high compared to what he was getting out of the formal courses. Better, he thought, to let his parents keep the money. A couple of years later Jobs founded Apple computer, but he credits its success to the freedom he gained to explore new activities without the structure of a college degree. Larry Ellison of Oracle, sitting right across from the president, also chose not to complete a college degree.
But it is very important to point out that not every executive in the photo chose to drop out of college. Carol Bartz, at the far end of the table, graduated with a degree in computer science, earning tuition money as cocktail waitress. Years later, it seems clear that she made the right choice for her: the college degree prepared her to run tech firms like Yahoo. Dick Costolo of Twitter also finished college. Others not only chose to finish college, they chose to go on for more advanced degrees. Reed Hastings of Netflix chose to get a masters in business. President Obama chose to go law school. Eric Schmidt of Google and Art Levinson of Genentech chose to get a Ph.D.
So behind the people in the photo are many different stories of scarcity, choice, and opportunity cost. Of course, neither the people in this photo nor the 20 Under 20 prize-winners are a representative sample. Gary Becker provides data that may be more relevant to most students.