Weak Recovery Denial

Paul Krugman disagrees with my recent post that the recovery is weak compared to recoveries from past serious U.S. recessions including those associated with financial crises. I’ve been writing about the reasons for weak recovery for two years, but the issue has heated up because of its relevance to the elections this fall.

In making his critique, Krugman appeals to a recent oped in Bloomberg View by Carmen Reinhart and Ken Rogoff who criticize the research of economic historian Michael Bordo and his coauthor Joseph Haubrich of the Cleveland Fed, which I have referred to. Bordo and Haubrich demonstrate that the recovery from the recent recession and financial crisis has been unusually weak compared to recoveries from past recessions with financial crises in the United States. In separate research, Jerry Dwyer and Jim Lothian report the same finding. Neither Reinhart-Rogoff nor Krugman disprove this finding.

To see this, consider the points made by Reinhart and Rogoff, and also by Krugman.

First, they argue for a narrower definition of a financial crisis. Reinhart and Rogoff say that one should “distinguish systemic financial crises from more minor ones and from regular business cycles.” Thus they exclude some cases studied by Bordo and Haubrich. But narrowing the focus to systemic crises in this way does not change the Bordo-Haubrich findings because the recovery from the recent recession is weaker than the average of past recessions cum financial crises even with these exclusions.

Second, Reinhart and Rogoff argue that one should look at recessions together with recoveries when looking at severity. In fact, in their work they explicitly “don’t delineate between the ‘recession’ period and the ‘recovery’ period.” But there is no disagreement that recessions associated with financial crises have tended to be deeper than those without financial crises. I certainly don’t deny that there was a serious financial crisis. In fact I wrote one of the first books on the crisis and found that government policy prior to 2009 was to blame, just as government policy was to blame for the even more serious Great Depression.

The issue that I and others have focused on is whether the recovery is unusually weak. By mixing recessions with recoveries Reinhart and Rogoff blur the classic distinction, which has long been at the heart of macroeconomic analysis. Because they do not examine recoveries per se, their empirical analysis does not disprove the fact that the current recovery is very weak as Bordo and Haubrich and others have shown.

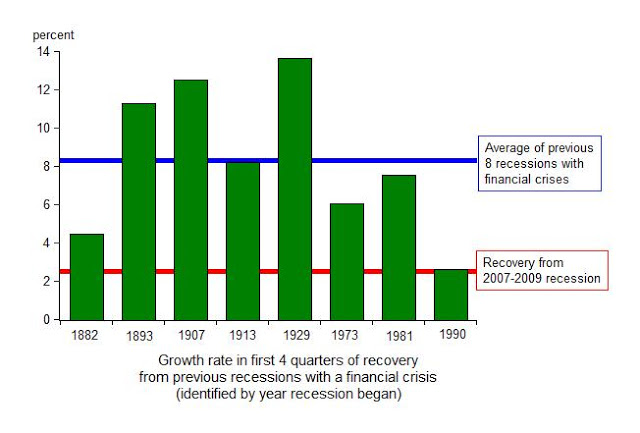
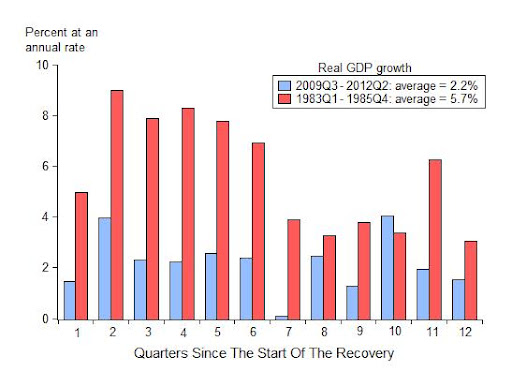
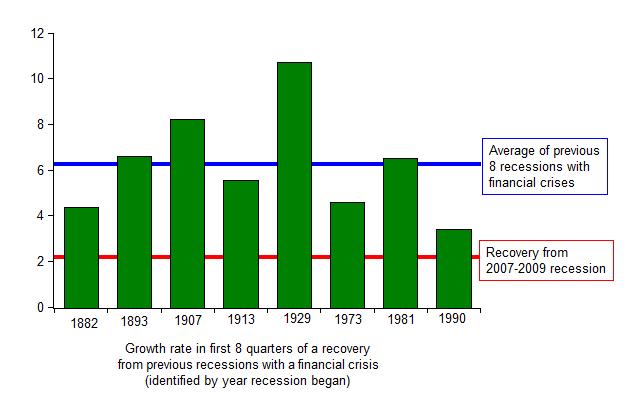
Third, there is the complaint that in a simple chart I used to show how weak the recovery has been, I only looked at the first four quarters of recovery. But I also mentioned that Bordo and Haubrich use a different measure, which goes well beyond 4 quarters, and come to the same conclusion, and also that the current recovery has weakened further since the first four quarters. In any case, the focus on four quarters has nothing to do with it. Here is a chart that looks at growth during the first eight quarters. The story is the same.

Since most of the Reinhart, Rogoff and Krugman criticism is implicitly aimed at the historical work of Bordo and Haubrich, it is appropriate to conclude with what Bordo wrote in response to a press inquiry which he shared with me. Bordo puts it this way:

Aside from the unnecessary political rhetoric and ad hominems, the basic difference between my research with Joseph Haubrich on U.S. recoveries and that of Carmen Reinhart and Ken Rogoff is over the methodology of defining a recovery. Reinhart and Rogoff focus on the behavior of the level of real per capita GDP from the peak preceding the financial crisis to the point in the succeeding recovery at which the earlier peak level of real per capita GDP is reached. We look at what is called the bounce back, the pace of recovery from the trough of the business cycle.

We find that deep recessions accompanied by financial crises bounce back faster than recessions which do not have financial crises. These results are even stronger when we focus on what Reinhart and Rogoff call systemic crises, like 1893 and 1907. The recent recession and financial crisis is a major exception to this pattern. The recovery remains tepid after three years.

Reinhart and Rogoff s methodology combines the downturn with the recovery. Using our data but following their approach one would get the same results as they do, that recessions with financial crises have slow recoveries as I show in my Wall Street Journal op ed. Their use of real per capita GDP rather than just real GDP would not make any difference to our results. Thus comparing their methodology with ours is like comparing apples with oranges. Our approach focuses directly on the question– are recoveries after recessions with financial crises associated with slower or faster than average recoveries. Their approach answers a different question than we ask.

In sum, the weak recovery deniers have not made their case.

Posted in Slow Recovery | Comments Off on Weak Recovery Denial

More on the Unusually Weak Recovery

The weak recovery continues to be a major topic. Over the weekend, Russ Roberts issued the second episode of his three part “chartcast” series on the topic, which is based on interviews with me and builds on his highly-regarded podcast series, but with helpful charts and illustrations. (Here is the first episode). Among other things we discuss the work of Mike Bordo and Joe Haubrich on the unusual nature of this recovery, and their views of the work by Carmen Reinhart and Ken Rogoff.Also, as Jon Hilsenrath and Ezra Klein report, over the weekend Carmen Reinhart and Ken Rogoff released a short rebuttal to Bordo and Haubrich as well as to several opeds. Reinhart and Rogoff argue in favor of a narrower definition of a financial crisis, and they thus focus on a subset of the eight Bordo-Haubrich recessions with financial crises (for example, they exclude 1913 and 1982). This alone does not change the Bordo-Haubrich results as the figure in my post of last week makes clear. But Reinhart and Rogoff argue that one should look at the downturn as well as the recovery when looking at severity. There is no disagreement that recessions associated with financial crises have tended to be deeper than those without financial crises. The disagreement is over the recoveries. By mixing downturns with recoveries Reinhart and Rogoff get different results from Bordo and Haubrich.

But the question for policy now is whether the recovery has been unusually slow compared to earlier recoveries from recessions with financial crises, and the evidence is still clear that it has been. Papers in the book Government Policies and the Delayed Economic Recovery edited by Lee Ohanian, Ian Wright, and me show that policy is the reason.

Posted in Slow Recovery | Leave a comment

Getting Tax Reform History Right

“For the past 75 years or so, tax reform has been defined by a tradeoff: broaden the tax base and lower rates,” as tax historian Joseph Thorndike explained in a recent article. That’s the framework behind the Romney tax reform proposal, as well as the last major federal tax reform in 1986. History tells us that such a strategy will work if the tradeoff and its pro-growth purpose are explained to the American people, and the mechanics of base expansion are then worked out in bipartisan negotiations with Congress. That’s the lesson from the 1986 tax reform in which Ronald Reagan put forth the general framework and the details were then negotiated with Democrats and Republicans in Congress. That history lesson is very important now, but it will be lost if Americans don’t get the history right.

That is why my colleague and tax expert Charlie McLure was so concerned when he heard Vice-President Biden describe President Reagan’s approach to the 1986 tax reform in the vice-presidential debate this week. Charlie served in the U.S. Treasury in the 1980s and was responsible for preparing the tax proposals for President Reagan. As Charlie explained in an email yesterday, the history told in the debate wasn’t right:

During the Vice-Presidential debate, Vice-President Joe Biden asserted that President Ronald Reagan made his tax reform proposals public. The implication – and the only context in which the assertion would be relevant – is that he did so during the 1984 Presidential campaign. This is not true. As Deputy Assistant Secretary of the Treasury, I was responsible for preparation of the Treasury Department’s proposals to President Reagan. In his 1984 State of the Union address, President Reagan gave Treasury Secretary Don Regan the mandate to send him the proposals by a date in November that fell after the election. That is what we did. The President did not endorse the Department’s proposals and did not send his proposals to the Congress until May 1985, six months after the election. Had he done that before the election, the resulting demagoguery would have forced him to take so many options off the table that the Tax Reform Act of 1986 would not have happened – or at least would not have been the landmark legislation that it was.”

Posted in Fiscal Policy and Reforms | Comments Off on Getting Tax Reform History Right

Simple Proof That Strong Growth Has Typically Followed Financial Crises

People are looking for answers to why the economy is growing so slowly. Is the answer that economic growth is normally weak following deep recessions and financial crises, as, for example, Kenneth Arrow argued in the presidential election event with me this week at Stanford? Or is poor economic policy the answer, as I argued?

nine recoveries

In my view the facts contradict the “deep recession cum financial crisis” answer, so I have focused my research on economic policy and have found that the answer lies there. The chart below illustrates these facts. It is derived from historical data reported in a paper by economic historians Michael Bordo of Rutgers and Joe Haubrich at the Cleveland Fed.

Posted in Slow Recovery | Comments Off on Simple Proof That Strong Growth Has Typically Followed Financial Crises

Recent Part-time Job Increase Is Not a Good Sign

Many have noted the large September increase in “part-time employment for economic reasons” reported in the BLS household survey. The 582,000 increase in these part time jobs caused total employment to rise by 873,000—a major reason for the decrease of the overall unemployment rate, and the broader U-6 measure of labor underutilization—which adds in this part-time employment—did not decline at all.

This increase in part time jobs is not a good sign for the economy.

Joe LaVorgna, chief US economist at Deutsche Bank, argues that the part-time increase is likely due to the election. He offers two pieces of evidence. First, there was an unusually large gain in non-private employment, defined as total employment less “private industries” employment, which thus includes campaign workers who organize grass roots efforts, make phone calls, knock on doors, or help at political conventions. Second, there was an unusually large increase in employment in the 20 to 24 year age group—a typical age for campaign workers. The explanation is appealing because both Democrats and Republicans are increasing such grass roots campaigns. State data—especially from the swing states—is needed to confirm LaVorgna’s hypothesis. But if true the increase in part time employment is not a sign of an improving economy: it implies that the jobs gain in September is largely temporary.

Another view is that the increase in part-time employment is directly due to the weak recovery, and a sign that it is getting weaker. Surges in part time employment frequently occur in times of economic stress. Consider, for example, all the months in which part time employment rose by 500,000 or more. There are 13 such monthly increases in the BLS data base—Jan 1958, Mar 1958, Jan 1975, May 1980, Oct 1981, Feb 1982, Feb 1991, Sep 2001, Nov 2008, Dec 2008, Feb 2009, Sep 2010, Sep 2012. With two exceptions, every one of these occurred during recessions when the economy was sharply contracting. The two exceptions are in the current recovery, which ia another measure of its weakness.

Even more troublesome is that in the past 6 months of the recovery, the entire employment increase was more than accounted for by part time jobs: Total employment rose by 940,000 from March to September and part time employment rose by 941,000. This deterioration in the labor market is consistent with the dip in economic growth to 1.3 percent in the 2nd quarter. It too is not a sign that the economy is improving.

Posted in Regulatory Policy | Comments Off on Recent Part-time Job Increase Is Not a Good Sign

From Economic Scare Stories to the Other Side of Reality

Twenty years ago this month my colleague Bob Hall and I wrote an op-ed for the New York Times about how “in recent months press reporting about the economy has become so pessimistic that it has completely lost touch with reality.” (October 16, 1992). The Times editors headlined our article “Economic Scare Stories,” which captured our point perfectly and fit the Halloween season. In October 1992, economic growth was improving following the 1990-91 recession, but most reporting looked beyond good economic news and said that the economy was doing poorly. Amazingly, the frequently-reported view that the economy in October 1992 was like the Great Depression went unchallenged. So we challenged it, hoping that our article would in some small way result in improved reporting.

Today press reporting seems to have switched to the other side of reality. Compared to October 1992, economic growth is now slower, unemployment is higher, and tragically the long-term unemployment rate is twice has high. And reported economic growth has been declining rather than improving as it was in 1992. Yet, in recent months much reporting about the economy has turned so upbeat that it has again lost touch with reality. Many look beyond the tragic growth or employment news and say that the economy is improving, or that things could have been worse, emphasizing that it is fortunately nothing like the Great Depression.

When asked what caused the switch, I answer, facetiously, that people must have read our article, remembered it, tried to make a correction, but unintentionally overcorrected. That answer, of course, is out of touch with the reality that both October 1992 and October 2012 constitute the final days of a presidential election where the main issue is the economy, and, as Bob Hall and I wrote, “people’s perceptions about the economy affect elections.”

Posted in Slow Recovery | Comments Off on From Economic Scare Stories to the Other Side of Reality

Regulatory Expansion Versus Economic Expansion in Two Recoveries

Much can be learned by comparing the very weak recovery from the 2007-2009 recession with the very strong recovery from the 1981-82 recession. Both recessions were severe, and U.S. history shows that severe recessions tend to be followed by fast recoveries, even when the severe recession is due to a financial crisis. But growth has averaged only 2.2 percent in this recovery while it averaged 5.7 percent in the 1980s recovery as shown in this chart.

As I testified in a House Judiciary Committee hearing on regulation yesterday, I’ve come to the conclusion that the difference between the two recoveries is due a difference in government policies, including regulatory policy.
One measure of the difference between the regulatory policies in the two recoveries is shown in the next chart. It compares the number of federal workers engaged in regulatory activities in the years before and during both recoveries. Note that in the early 1980s the number of federal workers in these regulatory areas was declining, in sharp contrast to the situation now, even when TSA workers are excluded as in this chart.
While correlation does not prove causation, regulations, whatever their benefits, tend to raise the cost of doing business and thus discourage business expansion and economic growth. This does not imply that increased regulation was the cause of the recession, which was surely due to other factors including financial and monetary shocks. But had legislation been passed into law to contain the recent regulatory expansion, it is likely that we would have had a stronger economic recovery.
The data on federal workers comes from this paper by Susan Dudley and Melissa Warren.  This chart shows the full series going back to the 1960s, again adjusted for TSA workers in recent years.
Posted in Regulatory Policy | Comments Off on Regulatory Expansion Versus Economic Expansion in Two Recoveries

The Eroding Effect of QE3 on Mortgage Spreads

It has been a week now since the Fed’s QE3 announcement that it would be again buying mortgage backed securities (MBS). There was an initial decline in the mortgage spread on the announcement but, as often happens, that initial impact seems to have been eroding away day by day.

Take a look at this Bloomberg chart of the option adjusted spread (OAS) for mortgage securities. Wednesday September 12 is marked so you can see the effect on Thursday September 13 when the Fed made the announcement. The spread moved down again on Friday, but this week it went back up. By Wednesday September 19 it had completely returned to the pre-announcement value. The effect on the spread has eroded away.

Of course, the effect of the announcement could already have been discounted before September 13, in which case some of the earlier downward movements could be attributed to QE3. Nonetheless, this real time experience is a good illustration of why announcement day measures—which the Fed has relied on to assess its LSAP programs—can be misleading. This is why Johannes Stroebel and I used other techniques in our analysis of the earlier MBS program, in which we did not find significant effects.

One should also note that the effect on mortgage rates depends on what happens to other rates, such as Treasury yields, as well as the spread. But the yield on 10-year Treasuries has risen since QE3. So in effct, the overall effect on mortgage rates could even end up being counter to the Fed’s intentions in the end.

Posted in Monetary Policy | Comments Off on The Eroding Effect of QE3 on Mortgage Spreads

A New Chart Cast on the Bad News Recovery

As many have observed the employment report for August released today was disappointing news, but it really is a continuation of a steady stream of bad employment news that has been the story of this recovery since its beginning. The economy is growing too slowly to increase jobs at a pace that matches the growing population—unlike previous recoveries from deep recessions.
Here is an update of the chart that compares the change in the employment to population ratio in this recovery with the recovery from the deep slump of the early 1980s. This percentage dropped a litttle in August, but the big story is that there has never been a lift off.
Russ Roberts has produced a fascinating a new “chartcast” which illustrates how unusually poor this recovery has been.  Through a series of questions and answers he traces through several key charts with me. It is a visual version of his very successful podcast series Econ Talk.
Russ is planning a follow-up chartcast which gets into the causes of the slow recovery.
Posted in Slow Recovery | Comments Off on A New Chart Cast on the Bad News Recovery

Strong Push Back at Jackson Hole

In his Jackson Hole speech, Ben Bernanke argued that quantitative easing (in particular Large Scale Asset Purchases, or LSAPs) has had large macroeconomic effects, saying that “a study using the Board’s FRB/US model of the economy found that, as of 2012, the first two rounds of LSAPs may have raised the level of output by almost 3 percent and increased private payroll employment by more than 2 million jobs, relative to what otherwise would have occurred.” He footnoted a Fed paper by Hess Chung et al, in which the authors plugged in other people’s estimates of the impact of LSAPs on long term rates into the FRB/US model which does not have its own estimates.

However, a number of conference participants pushed back on this view, including John Ryding of RDQ, Mickey Levy of Bank of American and me, but most of all Michael Woodford whose paper showed in detail how empirical evidence and basic economic theory did not support these beneficial effects.

Woodford’s empirical evidence included a simple graph (Fig 15) showing that there was no economic growth effect around the times of the expansions in the size of the Fed’s balance and thus that the quantitative easing had “little evident effect on aggregate nominal expenditure…”

He challenged the view that the LSAPs lowered long term rates or at least had the kind of impact assumed by Chung et al. He explained that “‘portfolio-balance effects’ do not exist in a modern, general-equilibrium theory of asset prices…” which is what many of us have been teaching students for thirty years. 

He questioned the various event studies cited by the Fed, such as Gagnon et al, saying “it is not clear that their announcement-days-only measure should be regarded as correct.”

He showed that the often-cited evidence reported by Arvind Krishnamurthy and Annette Vissing-Jorgensen that “purchases of long-term Treasuries could raise the price of (and so lower the yield on) Treasuries…would not necessarily imply any reduction in other long-term interest rates, since the increase in the price of Treasuries would reflect an increase in the safety premium, and not necessarily any increase in their price apart from the safety premium…This means that while the US Treasury would then be able to finance itself more cheaply at the margin, there would not necessarily be any such benefit for private borrowers, and hence any stimulus to aggregate expenditure….There seems little reason to believe that purchases of long-term Treasuries should be an effective way of lowering the kind of longer-term interest rates that matter most for stimulating economic activity.”

Woodford also questioned the beneficial impacts of forward guidance as practiced by the Fed so far, saying that “simply presenting a forecast that the policy rate will remain lower for longer than had previously been expected, in the absence of any reason to believe that future policy decisions will be made in a different way, runs the risk of being interpreted as simply an announcement that the future is likely to involve lower real income growth and/or lower inflation than had previously been anticipated — information that, if believed, should have a contractionary rather than an expansionary effect.”

In Woodford’s view, forward guidance could have achieved positive effects if it had “made it clear that short-term interest rates will not immediately be increased as soon as a Taylor rule descriptive of past FOMC behavior would justify a funds rate above 25 basis points,” because “this would provide a reason for market participants to expect easier future monetary and financial conditions than they may currently be anticipating, and that should both ease current financial conditions and provide an incentive for increased spending.”

Many Fed watchers interpreted the benefit-cost analysis in Ben Bernanke’s speech as signaling more quantitative easing. But viewed in the context of the whole Jackson Hole meeting, which many FOMC members attended, the benefits are considerably smaller than stated in that speech, and perhaps even negative.

Posted in Monetary Policy | Comments Off on Strong Push Back at Jackson Hole