Monetary Policy and the Wisdom of Wayne Gretzky

I’m always trying to find good ways to teach beginning economics students about monetary policy. For years I compared it to flying a fighter jet where you have to anticipate the actions of the other pilots, and if you get it wrong you crash and burn in a great depression or a great inflation. I liked to show the scene from the movie Top Gun where, in a classroom scene after a flight, instructor Kelly McGillis (Charlie) chastises fighter pilot Tom Cruise (Maverick) for a near crash and burn because of his risky behavior. I stopped showing that scene because the next scene is quite a bit more intimate, not really appropriate for an introductory economics class, and if you do not stop the DVD just in time the students get completely distracted from the subject of monetary policy. Once while I was lecturing at West Point the DVD didn’t stop and the movie rolled on past the classroom scene to the next scene to a roar of laughter from hundreds of Army cadets in the lecture hall watching the big screen behind me.

So I was pleased that Philadelphia Fed President Charles Plosser, in a speech last Tuesday in Rochester, came up with an even better analogy: hockey. He tells the story of how “Hockey great Wayne Gretzky was once asked about his success on the ice. He responded by saying, ‘I skate to where the puck is going to be, not to where it has been.’ He didn’t chase the puck. Instead, Gretzky wanted his hockey stick to be where the puck would be going next. He scored many goals with that strategy, and I believe monetary policymakers can better achieve their goals, too, if they follow the Gretzky strategy.”

Posted in Monetary Policy | Comments Off on Monetary Policy and the Wisdom of Wayne Gretzky

Be Thankful But Study What Happened

With the consumption data released today–the day before Thanksgiving–we are reminded to give thanks that retail sales are at least growing not declining sharply as they were a year ago. But what was it really like out there day-by-day in the shopping centers a year ago? How rapidly were sales declining? And what did it have to do with what was happening on Wall Street? To answer these questions, I examined daily retail sales from Target stores in the weeks before Thanksgivng last year. The data were provided to me courtesy of the Target Corporation.

Daily sales are hard to analyze because they jump around so much and because there are stong seasonals and huge within-week variations as you can see in the first chart showing sales at Target stores around the country. But after adjusting the data for these factors one can see more clearly what was happening as shown in the adjusted data in the second chart. The details of how you get from the first chart to the second chart are in my note Analysis of Daily Sales Data during the Financial Panic of 2008. As shown in the second chart, daily sales had been declining in the summer of 2008 compared to 2007, as the recession began in late 2007. But there was a noticeable acceleration in the decline from September to November 2008. The acceleration appeared to start before the Lehman bankruptcy on September 15, and there was no noticeable effect at the time of that bankruptcy or shortly thereafter. It was not until a week later that sales really began their precipitous decline in panic-like fashion that paralleled the panic in the financial markets. This was during the chaotic period that various government responses were being proposed, debated, criticized, and implemented, suggesting that these responses were themselves a factor. However, it is difficult to find a negative impact on sales of single events or dates during the panic. Rather there appears to have been a more cumulative, yet still very sharp, negative impact
Posted in Regulatory Policy | Comments Off on Be Thankful But Study What Happened

Economic Freedom and Rose Friedman

We are hearing a lot these days about the disadvantages of free markets and the need for a greatly expanded role of government in the economy. Last month I spoke at a wonderful memorial for Rose Friedman. We celebrated among other things about Rose’s life, her strong advocacy, along with her husband Milton Friedman, of free markets, starting in the 1940s and 1950s, another time of talk about the disdvangates of free markts. The memorial took place at the Hoover Institution on the Stanford campus. George Shultz, David Friedman, Bob Chitester, and others spoke. There was a lot of talk about the need to reenter the fray. I spoke about how Rose was an inspiration for anyone who wishes to do so.

Posted in Regulatory Policy | Comments Off on Economic Freedom and Rose Friedman

New Evidence of Government Induced Risk

A year ago I wrote Getting Off Track one of the first books on the financial crisis. I argued, based on data available at the time, that government actions caused, prolonged and worsened the crisis. After a year of debate, this early assessment is holding up well. Indeed it is being reinforced by new evidence.

Consider, for example, the government actions associated with the takeover of Fannie and Freddie in 2008. Of course, Fannie and Freddie were a big part of the reason for the explosion in mortgage debt including risky subprime mortgages, but I want to focus now on the impact of government actions relating to these institutions during the period leading up to the panic in 2008.

A good way to assess this impact on risks is to look at the spread between interest rates on subordinated debt and senior debt at Fannie or Freddie. When investor concerns about risks at the institutions increase, the interest rate spread between subordinated and senior debt rises. So what caused the movements in these spreads in 2008?

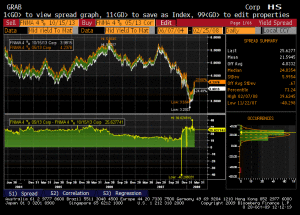
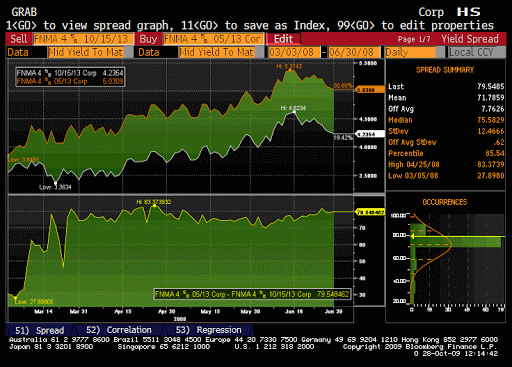
The three charts show the spread between the interest rate on Fannie Mae subordinated debt and Fannie Mae senior debt over three different periods. The yellow line with the green shading in the lower panel of each chart is the interest rate spread of sub debt over senior debt. In the top panel (harder to read) the orange line is the rate on subordinated debt and the white line is the rate on senior debt. The first chart focuses on the period from June 2004 to February 2008. The spread was fairly stable fluctuating in a rather narrow range around 20 basis points over this period.

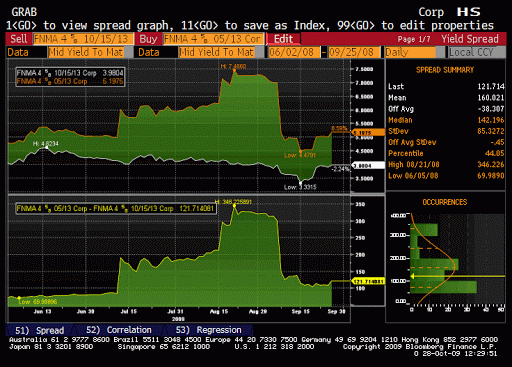
The second chart covers the period from March 2008 through June 2008. Observe that the spread jumped to around 80 basis points after the Bear Stearns intervention. Unlike many other risk spreads it did not come back down after Bear Stearns.

The third chart focuses on the period from July 2008 through September 2008. There are two big upward jumps during this period. The first was on July 11. What was the big event that day? It was a leaked news story about a possible government action, a takeover of the two institutions. In particular the New York Times ran a front page story with the headline “U.S. Weighs Takeover of Two Mortgage Giants

The other big jump up was on Monday August 18th. Again the reason was a news story about another government action. The previous Friday the Washington Post reported that the Treasury hired Morgan Stanley to assess the vulnerability of Fannie and Freddie, a strong indicator that the government was looking for outside justification to take over the institutions. It is important to note also that certain other events, which could have moved the spread up, did not move it up. When Freddie and Fannie released their second quarter earnings in August, there was little to no reaction in the spread.

So the major movements are clearly linked to government policy decisions and news stories about them. This timing does not prove that the government actions were responsible, but at the least it raises questions about why rumors of possible government actions were leaked to the news media.

The questions are important because some government officials have indicated that these jumps in the subortinated debt spread were part of the evidence to justify the take over the institutions at this time. But the evidence shows that the government itself was increasing the spreads.
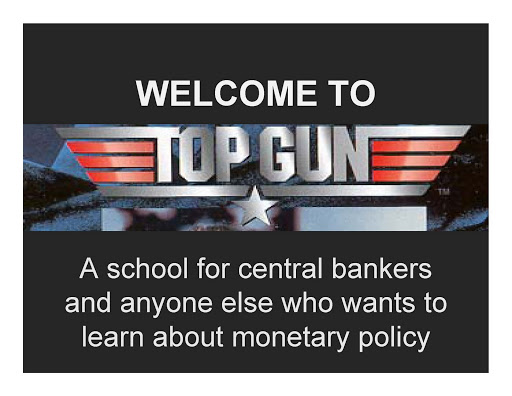
Posted in Monetary Policy | Comments Off on New Evidence of Government Induced Risk

Monetary Policy Week

This week was monetary policy week in Economics 1 at Stanford. It was also monetary policy week in Washington: the House Financial Services Committee surprisingly voted 43-26 for Ron Paul’s controversial bill to audit the Fed; the TARP inspector general found that the Fed’s AIG bailout was unnecessarily generous to creditors; and people continued to debate how long the Fed could hold the interest rate at zero without threatening the dollar.

To discuss the interest rate decision in my lectures, I made use of the Taylor Rule, a guideline for the Fed and other central banks to use in setting interest rates. To start I showed the students how to derive the rule from economic theory. Actually, the students derived the rule on their own–with the help of a little Socratic questioning–even choosing the signs of the coefficients and the target inflation rate (2 percent) correctly. I was happy to welcome the NewsHour’s Paul Solman and his camera crew who came to film part of this lecture. Here’s my paper on what others would later call the Taylor Rule

The Taylor Rule says the interest rate should equal one-and-a-half times the inflation rate plus one-half times the GDP gap plus 1. Rounding off to the nearest percent, inflation is running around 2 percent and the GDP gap around -8 percent, so the rule says the interest rate should be near 0, (1.5 x 2 + .5 x (-8) + 1 = 0) which is about where the Fed is now. As the economy recovers and real GDP increases, the Fed should raise rates. If inflation picks up too, it will have to do so more rapidly.

Several columnists and bloggers also used the Taylor Rule this week, including Gene Epstein of Barron’s in “Better Baking for the Bank: The Right Recipe for Rates.” The recommended interest rate setting can vary a bit because of different estimates of the inflation rate and the GDP gap (the percentage difference between real GDP and potential GDP). Epstein also finds the interest rate to be close to zero, but slightly higher at 0.6 percent.

But sometimes you read really wild things about what the interest rate should be. Paul Krugman’s Monday piece about the Taylor Rule is an example. He says he likes to use an estimate of the Taylor Rule. But the estimate is much different from the Taylor Rule, so he gets a much different interest rate setting of -7 percent! This implies that we are unlikely to see a positive interest rate for many years, which would be dangerous for the stability of dollar let alone the stability of the U.S. and world economy. I explained the problems with using such estimates in a Bloomberg oped several months ago. Estimates can perpetuate past mistkes. In the current environment they could lead to a repeat of the same mistakes that led to this deep recession. Michael McKee, in another Bloomberg opinion piece , suggested a line for me from Woody Allen’s Annie Hall, where Marshall McLuhan makes an appearance and tells an academic pontificating about McLuhan: “you know nothing of my work!”

Posted in Monetary Policy | Comments Off on Monetary Policy Week

The Road Ahead for the Fed

Stories this week in the Wall Street Journal, the New York Times and the Washington Post focus on how Senator Chris Dodd’s new financial reform bill threatens the independence of the Federal Reserve. And Larry Kudlow took it up on his CNBC program. Loss of Federal Reserve independence is a serious problem, especially at this time of rapidly increasing Federal debt and a greatly expanded Federal Reserve balance sheet. But an important issue not touched on in these stories is that Fed actions during the crisis have themselves raised questions about its independence. After reviewing these actions in the new book The Road Ahead for the Fed, former Secretary of Treasury George Shultz writes:

“Observing this process, the question comes forcefully at you: Has the Accord gone down the drain? And remember how difficult it was for the Fed to disentangle itself from the Treasury in the post-World War II period.”

Secretary Shultz is referring to the 1951 Accord where the Federal Reserve regained its independence following the World War II peg of Treasury borrowing rates. So even without the Dodd bill the Fed has a lot of work to do to disentangle itself. For a broader summary see Tom Simpson’s recent review of this book which came out of a conference hosted at the Hoover Institution at Stanford Univeristy by John Ciorciari and me last March.

Posted in Monetary Policy | Comments Off on The Road Ahead for the Fed

Jobs Saved: PR or Fact?

While the unemployment rate continues to rise–to 10.2 percent in October–the debate over the “jobs saved” concept also continues, most recently on last Sunday’s Meet the Press with host David Gregory asking Treasury Secretary Timothy Geithner whether the concept is PR or Fact. Gregory first quotes Allan Meltzer saying “One can search economic textbooks forever without finding a concept called ‘jobs saved.’ It doesn’t exist for good reason: how can anyone know that his or her job has been saved?” Gregory then pops the question to Secretary Geithner. Watch this short video clip for his answer, and then search your textbook as Professor Meltzer suggests.

Posted in Stimulus Impact | Comments Off on Jobs Saved: PR or Fact?

Government Failure versus Market Failure

My Forbes magazine column this week reviews the latest empirical evidence on why government actions and interventions–government failure rather than market failure–should be at the top of the list of what went wrong in the recent financial crisis. Some continue to be surprised by my finding. While I focus on macroeconomic policy, mainly monetary policy and fiscal policy, my finding that government failure rather than market failure rises to the top of the list is not at all unsual in the broader context of empirical policy evaluation research.

Cliff Winston of the Brookings Institution carefully reviews three decades of empirical research on a wide range of microeconomic policy studies in his important book Government Failure versus Market Failure. He comes to the same basic conclusion; as he puts it “thirty years of empirical evidence… suggests that the welfare cost of government failure may be considerably greater than that of market failure.”

It is interesting that he focuses on research done outside of government because, again as he puts it, “studies conducted by the government,…can be biased, inconsistent, and technically flawed.” So perhaps it is not surprising that so few government agencies or officials are pointing to government failure as the main problem in the recent financial crisis.

Posted in Regulatory Policy | Comments Off on Government Failure versus Market Failure

Greg Mankiw and Homework on Marginal Tax Rates

In an op-ed in today’s New York Times Harvard’s Greg Mankiw gives a good example of how government transfer programs increase marginal tax rates. He uses the same example assigned to Stanford’s introductory students in their homework last week–the Senate Finance Committee’s health care plan. Both Mankiw’s op-ed and the homework consider the marginal tax rate increase implicit in the plan. Students in introductory economics courses around the country are hearing a lot about the health care debate, which is what makes Greg’s column a good reading assignment.

Mankiw considers a family whose income rises from $54,000 to $66,000 and who loses $2,800 in government-provided health care benefits by earning $12,000 more income. The marginal tax rate is the lost benefit divided by the increase in income, which is a high 23 percent (2800 divided by 12000). The high marginal tax rate is a disincentive to work more.

The homework example has an even higher marginal tax rate and a larger disincentive. It consides a poorer familiy whose income rises from $24,000 to $48,000 and thus loses $7,300 in government-provided health care benefits according to the Senate plan. The marginal tax rate is 30 percent (7400 divided by 24000).

So the increase in marginal tax rates in the Senate plan is higher for poorer families.

Posted in Fiscal Policy and Reforms, Slow Recovery | Comments Off on Greg Mankiw and Homework on Marginal Tax Rates

National Accounts Show Stimulus Did Not Fuel GDP Growth

Along with the news that real GDP growth improved from -0.7 percent in the second quarter to 3.5 percent in the third quarter, the Bureau of Economic Analysis (BEA) released detailed National Income and Product Account tables yesterday, which received little comment in the press today. These tables make it very clear that the $787 billion stimulus package had virtually nothing to do with the improvement. Of the 4.2 percent improvement, more than half (2.36 percentage points) was due to firms cutting inventories at a less rapid pace, which has nothing to do with the stimulus. (For the details look at BEA’s Table 2 which shows that the contribution of inventory investment increased from -1.42 to .94 which equals 2.36.)

What about the other components of GDP? In particular what about government spending, which was supposed to be a big part of this stimulus? Government spending was a negative factor, subtracting 0.9 percentage points from the change in GDP growth.

Automobiles and parts contributed 1.15 percent for the quarterly improvement, but as today’s release of monthly data shows that was an unsustainable temporary blip: up in August and down in September due to cash for clunckers. Here is how BEA put it today: “Purchases of motor vehicles and parts accounted for most of the decrease [in real consumption] in September and for most of the increase in August, reflecting the impact of the federal CARS program (popularly called “cash for clunkers”). The program, which provided a credit for customers who purchased a qualifying new, more fuel efficient auto or light truck, ended on August 24, 2009.” And the latest consumption and income data in today’s release reveal no noticeable impact of the temporary tax rebates and one time payments on consumption as John Cogan, Volker Wieland and I had earlier shown.

Posted in Stimulus Impact | Comments Off on National Accounts Show Stimulus Did Not Fuel GDP Growth