In its recently released budget outlook, the Congressional Budget Office projects that this year’s federal deficit will increase by 35% from last year to $590 billion, and that the debt will rise from $14 trillion to $23 trillion by 2026, or from 77% to 86% of GDP. Clearly it’s time for a fiscal consolidation plan.
Yet we’re not hearing about any such a plan on the campaign trail. If anything candidates are proposing more, not less, federal government spending because many people think reducing the deficit is bad for the economy, even though modern economic models show this need not be the case. It would help the political debate if CBO would employ such state-of-the-art models, as I recommended here based on research with John Cogan, Volker Wieland and Maik Wolters.
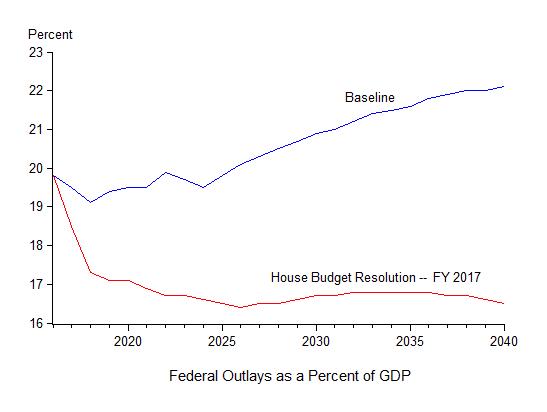
Actually the CBO might be getting closer to such a recommendation. This year the CBO estimated the impact of a fiscal consolidation plan proposed by the House Budget Committee. The plan, which was used in developing a budget resolution, would reduce the deficit mainly by reducing non-interest spending as a share of GDP compared to the baseline (from 22% to 17% by the year 2040), while increasing revenues as a share of GDP by a much smaller amount (.2%). Here is a graph showing the multi-year plan for non-interest spending (labeled Budget Resolution); it is unclear how much is discretionary versus mandatory spending, but based on the 2016 budget resolution (see summary here) it is mainly mandatory.
The CBO estimated the impact of this multi-year fiscal consolidation plan by combining a short-run Keynesian modeling approach with a long-run growth modeling approach. The Keynesian approach captures demand-side effects while the growth model captures supply-side effects due to changes in the capital stock and labor supply. As far as I can tell neither model is forward looking, but at least CBO’s approach to combining the models is clearly specified: Estimated output effects for the 1st, 2nd, 3rd, and 4th years of the consolidation plan have weights of 1.00, 0.75, 0.50, and 0.25, respectively, on the short-run model with the remaining weight on the long-run model. Estimates for the fifth year and beyond are based entirely on the long run model. (See the CBO report for more information). Obviously the weights are rather arbitrary, and I would prefer a single model which combines these effects in a consistent way and takes account of incentive effects. But at least it is a step in the right direction.
The results in terms of real GNP per person are shown here:

and percentage change from the baseline is shown here:
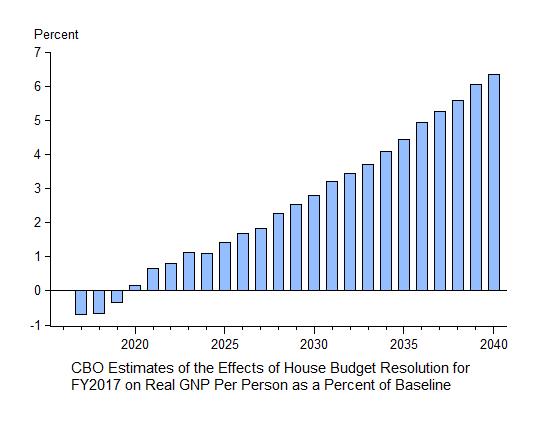
According to the CBO estimates, there is a negative demand-side effect in the short-run, but it is quite small especially compared with the larger and continuing longer-run supply side effects. Recall that in the Cogan, Taylor, Wieland, Wolters model, the short-run effects are all positive due largely to expectation effects. In any case, even the CBO finds the overall impact of fiscal consolidation to be, on balance, very positive for economic growth.


