I have heard more people talk about leaving California this year than at any other time in the past three decades, and I know quite a few who have already left, several for the second biggest population state, Texas, but also for Florida and Wyoming. It’s not so surprising. For many, the tax increase voted in last November in California was the last straw. California is now the state with the highest top marginal tax rate. The 9.3% bracket is now 10.3%, and the old 10.3% is now 13.3%. Texas has no income tax. Incentives matter.
But there’s another problem that also weighs on people’s minds and can affect migration decisions–education quality, and my colleague Rick Hanushek has created three illustrative bar charts which enable a comparison between California and other states. Let’s focus on Texas.
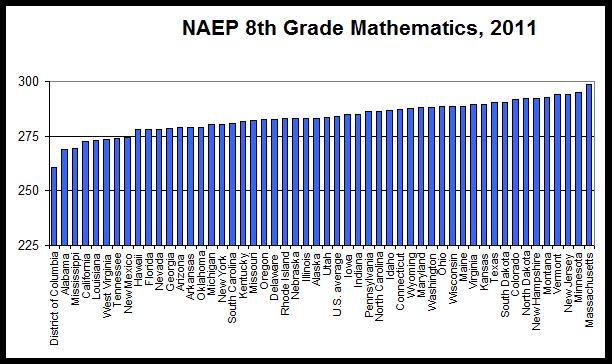
The first chart shows test scores in math for eighth graders using the National Assessment of Educational Progress (NAEP). California ranks 48th. Texas ranks 10th. So there’s another incentive effect
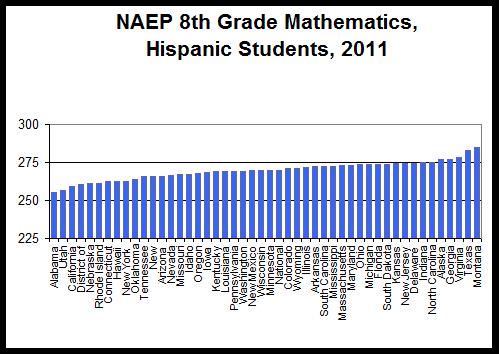
The next two charts are even more striking. The chart below shows 8th grade math scores for Hispanics. California now ranks a bit worse at 49th. But Texas ranks much higher, in 2nd place. The percentage of the population that is Hispanic is about the same in California and Texas.
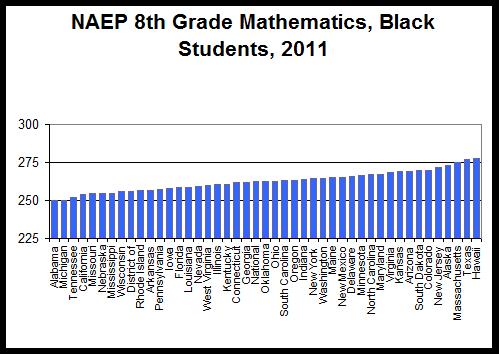
The third chart shows 8th grade math scores for blacks. Again California is near the bottom. And again Texas ranks 2nd.